

Corak sebenar

Inverse Head and Shoulder
was formed on 14.04 at 23:05:42 (UTC+0)
signal strength 1 of 5
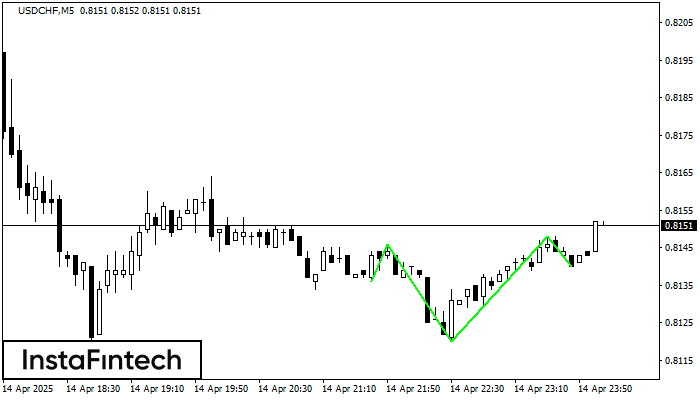
According to the chart of M5, USDCHF formed the Inverse Head and Shoulder pattern. The Head’s top is set at 0.8148 while the median line of the Neck is found at 0.8120/0.8140. The formation of the Inverse Head and Shoulder pattern evidently signals a reversal of the downward trend. In other words, in case the scenario comes true, the price of USDCHF will go towards 0.8163
The M5 and M15 time frames may have more false entry points.
- All
- All
- Bearish Rectangle
- Bearish Symmetrical Triangle
- Bearish Symmetrical Triangle
- Bullish Rectangle
- Double Top
- Double Top
- Triple Bottom
- Triple Bottom
- Triple Top
- Triple Top
- All
- All
- Buy
- Sale
- All
- 1
- 2
- 3
- 4
- 5
Persegi Bullish
was formed on 11.05 at 01:12:20 (UTC+0)
signal strength 1 of 5

Menurut grafik dari M5, #Bitcoin terbentuk Persegi Bullish. Pola menunjukkan kelanjutan tren. Batas atas adalah 103800.29, batas lebih rendah adalah 103508.08. Sinyal berarti posisi beli harus dibuka diatas batas atas
Rangka waktu M5 dan M15 mungkin memiliki lebih dari titik entri yang keliru.
Open chart in a new window
Teratas Ganda
was formed on 11.05 at 00:45:18 (UTC+0)
signal strength 1 of 5

Pada grafik #Bitcoin M5 pola reversal Teratas Ganda telah terbentuk. Karakteristik: batas atas 103800.29; batas bawah 103508.08; lebar pola 29221 poin. Sinyal: tembusan ke batas bawah akan menyebabkan kelanjutan tren
Rangka waktu M5 dan M15 mungkin memiliki lebih dari titik entri yang keliru.
Open chart in a new window
Persegi Bullish
was formed on 09.05 at 22:57:29 (UTC+0)
signal strength 1 of 5

Menurut grafik dari M5, GBPJPY terbentuk Persegi Bullish. Pola menunjukkan kelanjutan tren. Batas atas adalah 193.44, batas lebih rendah adalah 193.24. Sinyal berarti posisi beli harus dibuka diatas batas atas
Rangka waktu M5 dan M15 mungkin memiliki lebih dari titik entri yang keliru.
Open chart in a new window


