Double Bottom
was formed on 14.04 at 22:00:04 (UTC+0)
signal strength 1 of 5

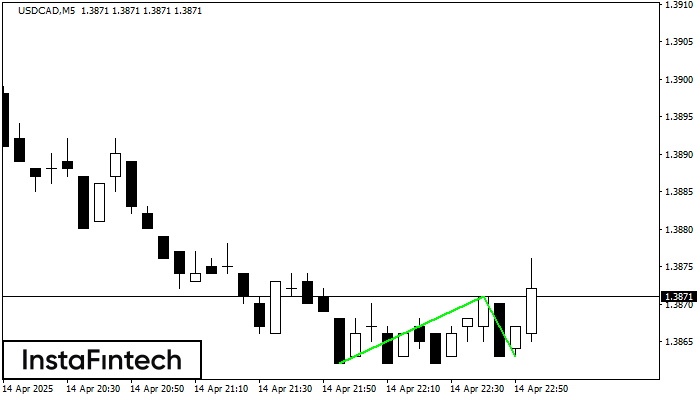
The Double Bottom pattern has been formed on USDCAD M5. Characteristics: the support level 1.3862; the resistance level 1.3871; the width of the pattern 9 points. If the resistance level is broken, a change in the trend can be predicted with the first target point lying at the distance of 8 points.
The M5 and M15 time frames may have more false entry points.
- All
- All
- Bearish Rectangle
- Bearish Symmetrical Triangle
- Bullish Rectangle
- Double Top
- Double Top
- Triple Bottom
- Triple Bottom
- Triple Top
- Triple Top
- All
- All
- Buy
- Sale
- All
- 1
- 2
- 3
- 4
- 5
รูปแบบกราฟธงปลายแหลมขาขึ้น (Bullish pennant)
was formed on 13.05 at 15:59:58 (UTC+0)
signal strength 1 of 5
รูปแบบกราฟิก รูปแบบกราฟธงปลายแหลมขาขึ้น (Bullish pennant) ได้สร้างขึ้นมาในตราสาร #MA M5 รูปแบบประเภทนี้จะอยู่ใน ประเภทของรูปแบบต่อเนื่อง ในกรณีเช่นนี้ ถ้าหากมูลค่าสามารถเคลื่อนตัวทะลุผ่านระดับสูงออกไปได้ ก็คาดการณ์ว่าจะยังเคลื่อนตัวไปยังแนวโน้มขาขึ้นที่ระดับ 582.75
ขอบเตระยะเวลาใน M5 และ M15 อาจจะมีตำแหน่งการเข้าใช้งานที่ผิดพลาดมากยิ่งขึ้น
Open chart in a new window
รูปแบบกราฟหัวและหัวไหล่แบบกลับหัว (Inverse Head and Shoulder)
was formed on 13.05 at 15:30:49 (UTC+0)
signal strength 2 of 5
อ้างอิงจากชาร์ตของ M15, #EBAY ที่ได้สร้างรูปแบบตาม รูปแบบกราฟหัวและหัวไหล่แบบกลับหัว (Inverse Head and Shoulder) ตำแหน่งของหัวอยู่ใน 67.86 ระหว่างนั้นเส้นระดับกลางของตำแหน่งคอ อยู่ในระดับที่ 69.55/69.12 การก่อตัวของรูปแบบ
ขอบเตระยะเวลาใน M5 และ M15 อาจจะมีตำแหน่งการเข้าใช้งานที่ผิดพลาดมากยิ่งขึ้น
Open chart in a new window
รูปแบบกราฟจุดสามยอดขาลง (Triple Bottom)
was formed on 13.05 at 15:30:05 (UTC+0)
signal strength 3 of 5
รูปแบบ รูปแบบกราฟจุดสามยอดขาลง (Triple Bottom) ได้สร้างขึ้นมาในชาร์ตของ EURGBP M30 ลักษณะของกราฟรูปแบบนี้: เส้นด้านล่างของกราฟรูปแบบนี้มีพิกัดอยู่ที่ 0.8426 พร้อมกับลิมิตด้านบน 0.8426/0.8410,ระยะของความกว้างคือ 22 จุด การก่อตัวของกราฟรูปแบบ
Open chart in a new window