

Corak sebenar

Double Top
was formed on 14.04 at 18:25:23 (UTC+0)
signal strength 1 of 5
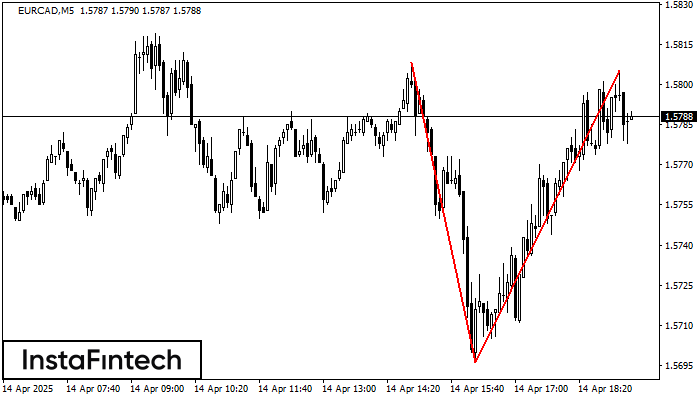
On the chart of EURCAD M5 the Double Top reversal pattern has been formed. Characteristics: the upper boundary 1.5805; the lower boundary 1.5696; the width of the pattern 109 points. The signal: a break of the lower boundary will cause continuation of the downward trend targeting the 1.5681 level.
The M5 and M15 time frames may have more false entry points.
- All
- All
- Bearish Rectangle
- Bearish Symmetrical Triangle
- Bearish Symmetrical Triangle
- Bullish Rectangle
- Double Top
- Double Top
- Triple Bottom
- Triple Bottom
- Triple Top
- Triple Top
- All
- All
- Buy
- Sale
- All
- 1
- 2
- 3
- 4
- 5
Double Bottom
was formed on 05.06 at 18:56:09 (UTC+0)
signal strength 1 of 5
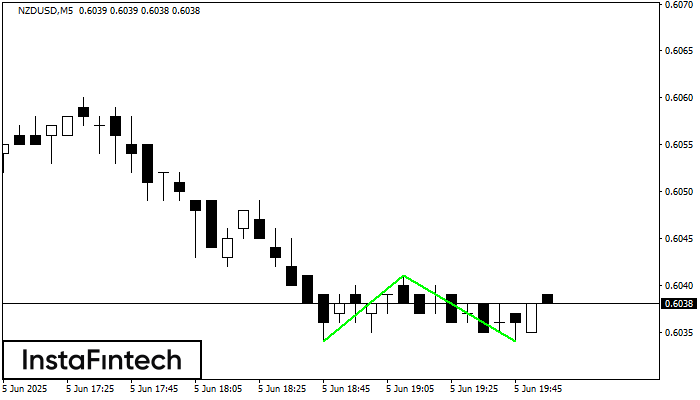
The Double Bottom pattern has been formed on NZDUSD M5. This formation signals a reversal of the trend from downwards to upwards. The signal is that a buy trade should
The M5 and M15 time frames may have more false entry points.
Open chart in a new window
Double Top
was formed on 05.06 at 18:45:35 (UTC+0)
signal strength 2 of 5
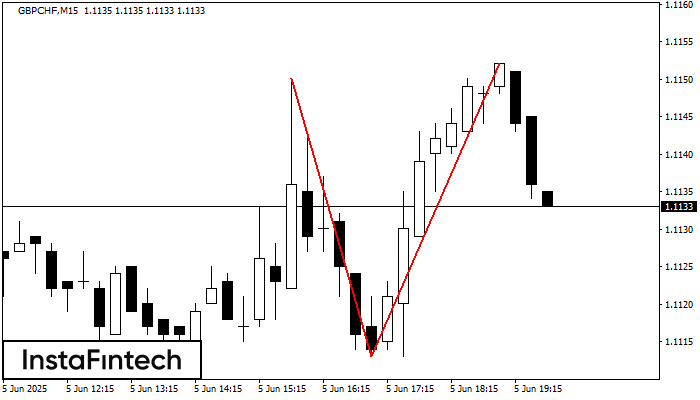
On the chart of GBPCHF M15 the Double Top reversal pattern has been formed. Characteristics: the upper boundary 1.1152; the lower boundary 1.1113; the width of the pattern 39 points
The M5 and M15 time frames may have more false entry points.
Open chart in a new window
Inverse Head and Shoulder
was formed on 05.06 at 18:30:26 (UTC+0)
signal strength 4 of 5
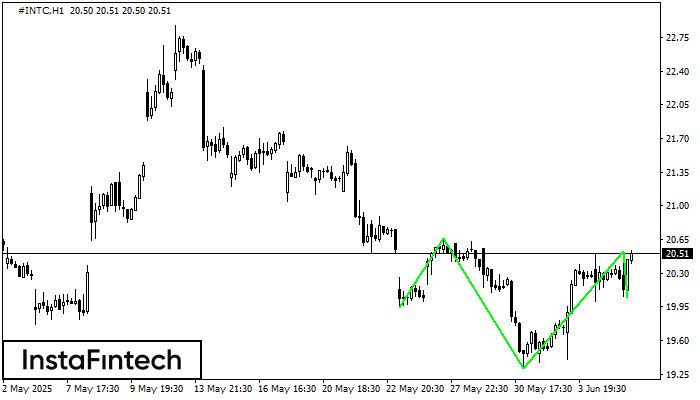
According to the chart of H1, #INTC formed the Inverse Head and Shoulder pattern. The Head’s top is set at 20.53 while the median line of the Neck is found
Open chart in a new window


