

Corak sebenar

Double Top
was formed on 14.04 at 16:45:14 (UTC+0)
signal strength 2 of 5
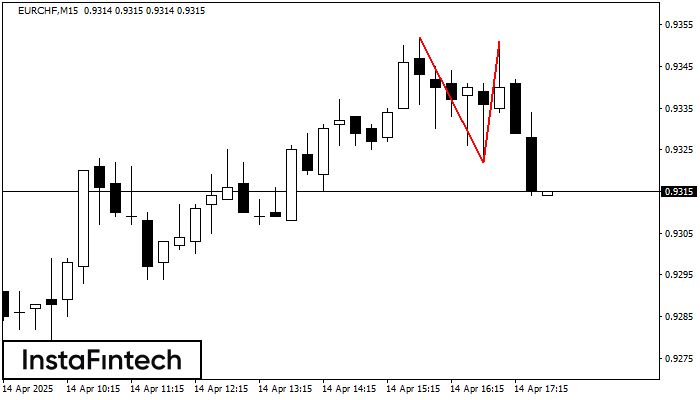
On the chart of EURCHF M15 the Double Top reversal pattern has been formed. Characteristics: the upper boundary 0.9351; the lower boundary 0.9322; the width of the pattern 29 points. The signal: a break of the lower boundary will cause continuation of the downward trend targeting the 0.9299 level.
The M5 and M15 time frames may have more false entry points.
Juga lihat
- All
- All
- Bearish Rectangle
- Bearish Symmetrical Triangle
- Bearish Symmetrical Triangle
- Bullish Rectangle
- Double Top
- Double Top
- Triple Bottom
- Triple Bottom
- Triple Top
- Triple Top
- All
- All
- Buy
- Sale
- All
- 1
- 2
- 3
- 4
- 5
Segi Tiga Simetri Menurun
was formed on 27.05 at 20:06:16 (UTC+0)
signal strength 1 of 5
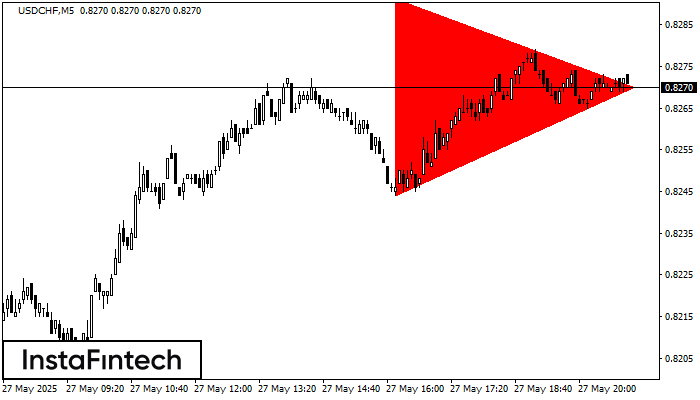
Berdasarkan carta M5, USDCHF membentuk corak Segi Tiga Simetri Menurun. Penerangan: Sempadan yang lebih rendah ialah 0.8244/0.8270 dan sempadan atas adalah 0.8291/0.8270. Lebar corak diukur pada carta pada -47 pips
Carta masa M5 dan M15 mungkin mempunyai lebih banyak titik kemasukan palsu.
Open chart in a new window
Segi Empat Menaik
was formed on 27.05 at 19:45:50 (UTC+0)
signal strength 1 of 5
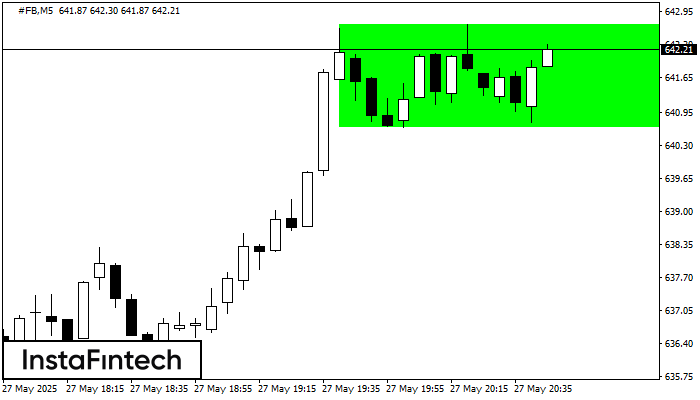
Berdasarkan carta M5, #FB telah membentuk Segi Empat Menaik. Corak ini menunjukkan kesinambungan aliran. Sempadan atas adalah 642.69, sempadan bawah adalah 640.66. Isyarat bermakna bahawa kedudukan panjang perlu dibuka
Carta masa M5 dan M15 mungkin mempunyai lebih banyak titik kemasukan palsu.
Open chart in a new window
Double Top
was formed on 27.05 at 19:40:20 (UTC+0)
signal strength 1 of 5
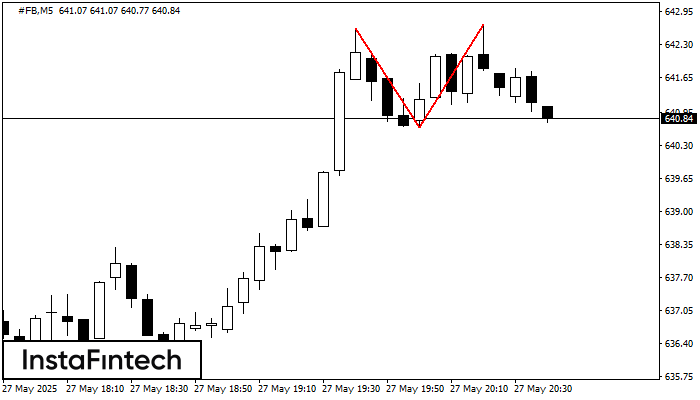
Corak Double Top telah dibentuk pada #FB M5. Isyarat bahawa aliran telah berubah dari aliran menaik ke aliran menurun. Mungkin, sekiranya asas corak 640.66 ditembusi, pergerakan menurun akan berterusan
Carta masa M5 dan M15 mungkin mempunyai lebih banyak titik kemasukan palsu.
Open chart in a new window


