

Corak sebenar

Bullish pennant
was formed on 14.04 at 16:05:59 (UTC+0)
signal strength 1 of 5

The Bullish pennant graphic pattern has formed on the #AAPL M5 instrument. This pattern type falls under the category of continuation patterns. In this case, if the quote can breaks out high, is expected to continue the upward trend to level 212.97.
The M5 and M15 time frames may have more false entry points.
- All
- All
- Bearish Rectangle
- Bearish Symmetrical Triangle
- Bearish Symmetrical Triangle
- Bullish Rectangle
- Double Top
- Double Top
- Triple Bottom
- Triple Bottom
- Triple Top
- Triple Top
- All
- All
- Buy
- Sale
- All
- 1
- 2
- 3
- 4
- 5
Double Top
was formed on 03.06 at 09:00:26 (UTC+0)
signal strength 4 of 5
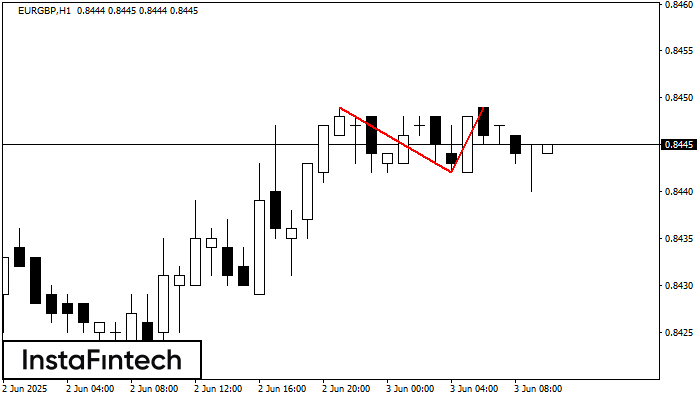
On the chart of EURGBP H1 the Double Top reversal pattern has been formed. Characteristics: the upper boundary 0.8449; the lower boundary 0.8442; the width of the pattern 7 points
Open chart in a new window
Triple Bottom
was formed on 03.06 at 09:00:20 (UTC+0)
signal strength 1 of 5
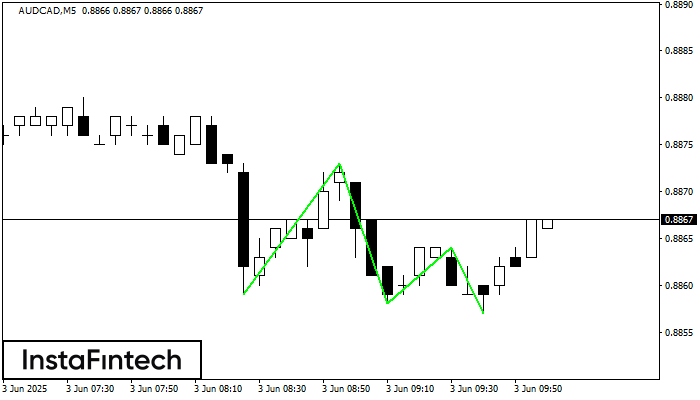
The Triple Bottom pattern has formed on the chart of AUDCAD M5. Features of the pattern: The lower line of the pattern has coordinates 0.8873 with the upper limit 0.8873/0.8864
The M5 and M15 time frames may have more false entry points.
Open chart in a new window
Double Bottom
was formed on 03.06 at 08:45:32 (UTC+0)
signal strength 1 of 5
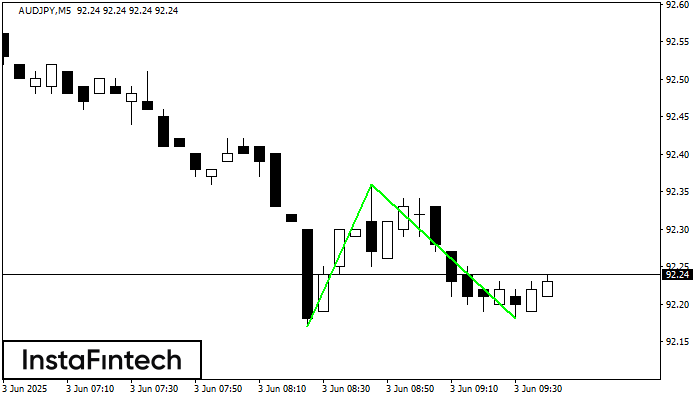
The Double Bottom pattern has been formed on AUDJPY M5. Characteristics: the support level 92.17; the resistance level 92.36; the width of the pattern 19 points. If the resistance level
The M5 and M15 time frames may have more false entry points.
Open chart in a new window


