

Corak sebenar

Triple Top
was formed on 14.04 at 13:55:08 (UTC+0)
signal strength 1 of 5
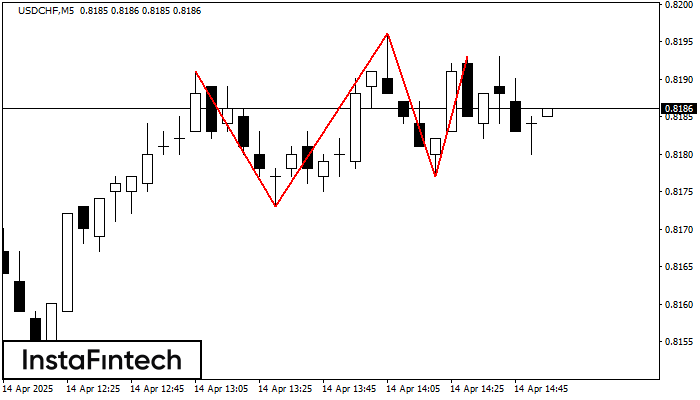
The Triple Top pattern has formed on the chart of the USDCHF M5 trading instrument. It is a reversal pattern featuring the following characteristics: resistance level -2, support level -4, and pattern’s width 18. Forecast If the price breaks through the support level 0.8173, it is likely to move further down to 0.8181.
The M5 and M15 time frames may have more false entry points.
- All
- All
- Bearish Rectangle
- Bearish Symmetrical Triangle
- Bearish Symmetrical Triangle
- Bullish Rectangle
- Double Top
- Double Top
- Triple Bottom
- Triple Bottom
- Triple Top
- Triple Top
- All
- All
- Buy
- Sale
- All
- 1
- 2
- 3
- 4
- 5
Triple Bottom
was formed on 30.05 at 11:36:39 (UTC+0)
signal strength 1 of 5
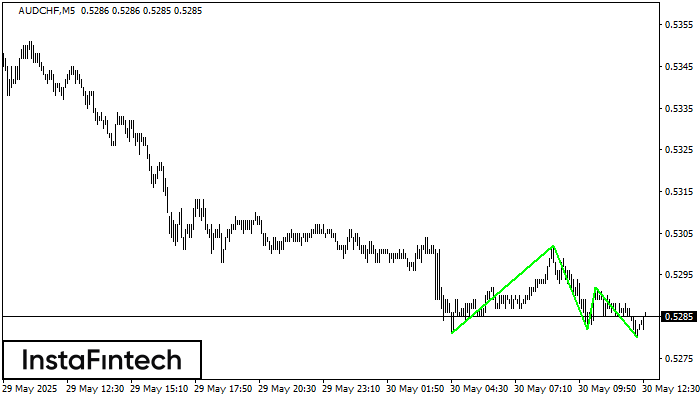
The Triple Bottom pattern has formed on the chart of AUDCHF M5. Features of the pattern: The lower line of the pattern has coordinates 0.5302 with the upper limit 0.5302/0.5292
The M5 and M15 time frames may have more false entry points.
Open chart in a new window
Triple Top
was formed on 30.05 at 10:55:16 (UTC+0)
signal strength 1 of 5
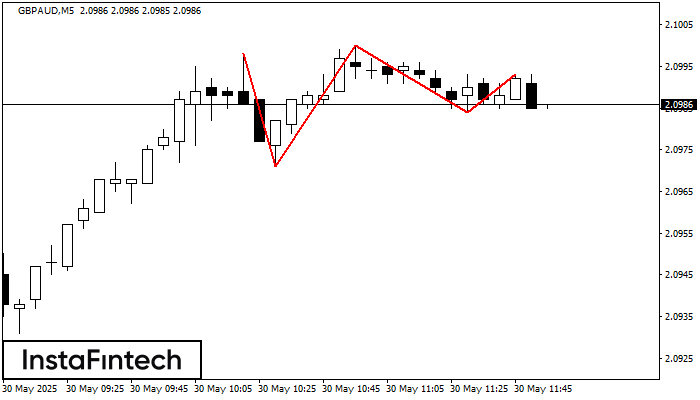
On the chart of the GBPAUD M5 trading instrument, the Triple Top pattern that signals a trend change has formed. It is possible that after formation of the third peak
The M5 and M15 time frames may have more false entry points.
Open chart in a new window
Bearish Rectangle
was formed on 30.05 at 10:51:48 (UTC+0)
signal strength 2 of 5
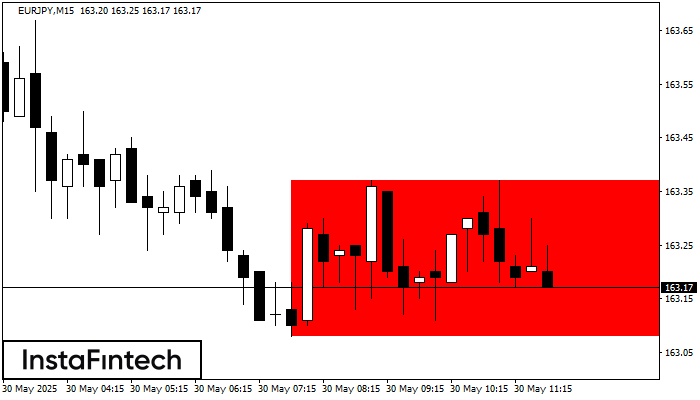
According to the chart of M15, EURJPY formed the Bearish Rectangle which is a pattern of a trend continuation. The pattern is contained within the following borders: lower border 163.08
The M5 and M15 time frames may have more false entry points.
Open chart in a new window


