

Corak sebenar

Bullish Rectangle
was formed on 14.04 at 13:01:10 (UTC+0)
signal strength 1 of 5
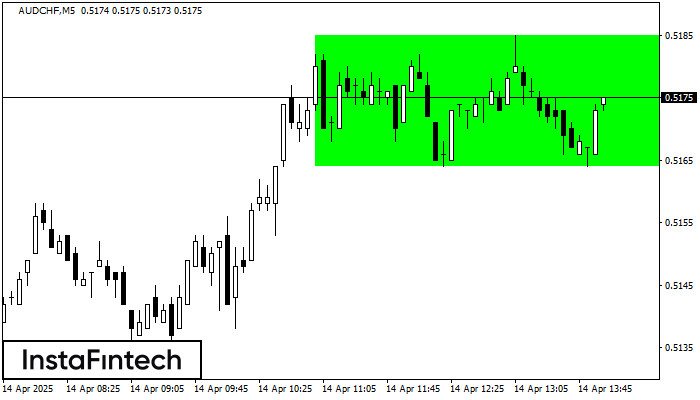
According to the chart of M5, AUDCHF formed the Bullish Rectangle. The pattern indicates a trend continuation. The upper border is 0.5185, the lower border is 0.5164. The signal means that a long position should be opened above the upper border 0.5185 of the Bullish Rectangle.
The M5 and M15 time frames may have more false entry points.
Juga lihat
- All
- All
- Bearish Rectangle
- Bearish Symmetrical Triangle
- Bearish Symmetrical Triangle
- Bullish Rectangle
- Double Top
- Double Top
- Triple Bottom
- Triple Bottom
- Triple Top
- Triple Top
- All
- All
- Buy
- Sale
- All
- 1
- 2
- 3
- 4
- 5
Double Top
was formed on 08.10 at 23:00:33 (UTC+0)
signal strength 3 of 5
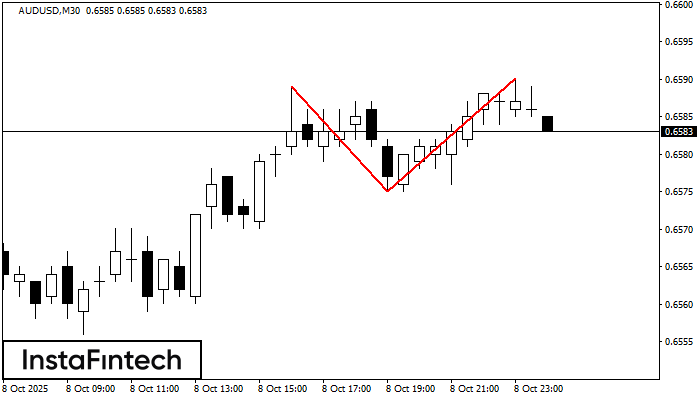
Corak Double Top telah dibentuk pada AUDUSD M30. Isyarat bahawa aliran telah berubah dari aliran menaik ke aliran menurun. Mungkin, sekiranya asas corak 0.6575 ditembusi, pergerakan menurun akan berterusan
Open chart in a new window
Double Top
was formed on 08.10 at 23:00:33 (UTC+0)
signal strength 1 of 5
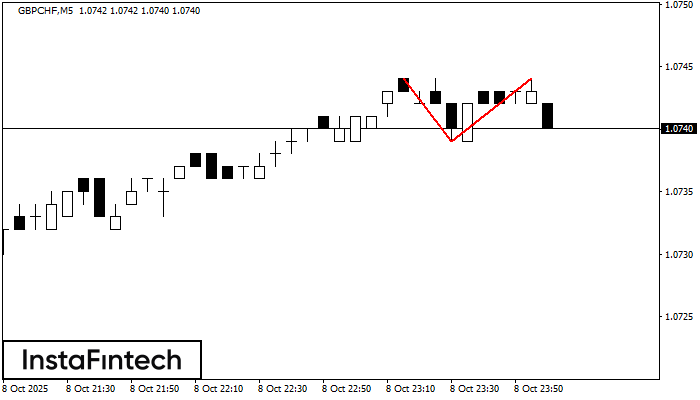
Pada carta GBPCHF M5 corak pembalikan Double Top telah terbentuk. Ciri-ciri: sempadan atas 1.0744; sempadan bawah 1.0739; lebar corak 5 mata. Isyarat: penembusan sempadan bawah akan menyebabkan kesinambungan arah aliran
Carta masa M5 dan M15 mungkin mempunyai lebih banyak titik kemasukan palsu.
Open chart in a new window
Triple Top
was formed on 08.10 at 23:00:32 (UTC+0)
signal strength 1 of 5
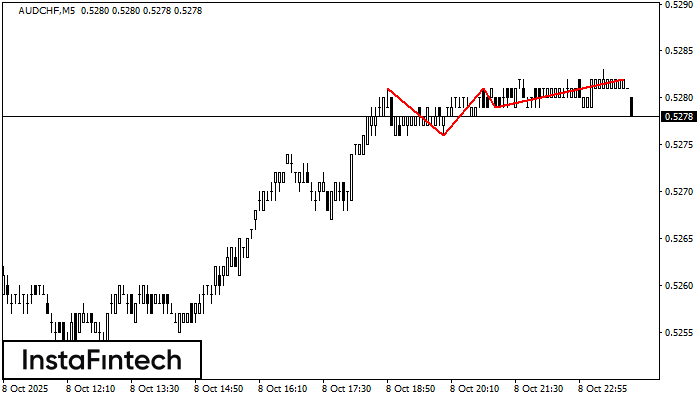
Corak Triple Top telah dibentuk pada carta bagi instrumen dagangan AUDCHF M5. Ia adalah corak pembalikan yang memaparkan ciri-ciri berikut: tahap rintangan -1, tahap sokongan -3, dan lebar corak
Carta masa M5 dan M15 mungkin mempunyai lebih banyak titik kemasukan palsu.
Open chart in a new window


