

Corak sebenar

Inverse Head and Shoulder
was formed on 14.04 at 12:00:29 (UTC+0)
signal strength 2 of 5

According to the chart of M15, USDJPY formed the Inverse Head and Shoulder pattern. The Head’s top is set at 143.17 while the median line of the Neck is found at 142.25/142.78. The formation of the Inverse Head and Shoulder pattern evidently signals a reversal of the downward trend. In other words, in case the scenario comes true, the price of USDJPY will go towards 143.40
The M5 and M15 time frames may have more false entry points.
- All
- All
- Bearish Rectangle
- Bearish Symmetrical Triangle
- Bearish Symmetrical Triangle
- Bullish Rectangle
- Double Top
- Double Top
- Triple Bottom
- Triple Bottom
- Triple Top
- Triple Top
- All
- All
- Buy
- Sale
- All
- 1
- 2
- 3
- 4
- 5
Head dan Shoulders
was formed on 25.04 at 11:16:23 (UTC+0)
signal strength 2 of 5

Corak teknikal yang dipanggil Head dan Shoulders telah muncul pada carta USDCHF M15. Terdapat alasan yang berat untuk menunjukkan bahawa harga akan mengatasi garisan Neck 0.8293/0.8295 selepas Shoulder kanan telah
Carta masa M5 dan M15 mungkin mempunyai lebih banyak titik kemasukan palsu.
Open chart in a new window
Double Bottom
was formed on 25.04 at 11:00:37 (UTC+0)
signal strength 1 of 5
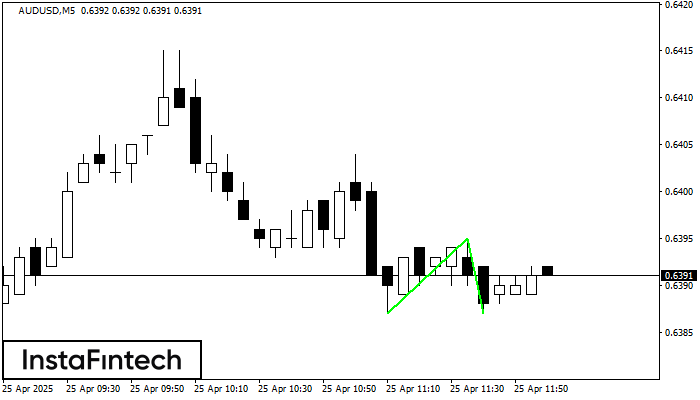
Corak Double Bottom telah dibentuk pada AUDUSD M5. Pembentukan ini menandakan pembalikan aliran dari aliran menurun ke atas. Isyarat ialah perdagangan membeli harus dibuka selepas sempadan atas corak 0.6395 telah
Carta masa M5 dan M15 mungkin mempunyai lebih banyak titik kemasukan palsu.
Open chart in a new window
Double Bottom
was formed on 25.04 at 10:50:23 (UTC+0)
signal strength 1 of 5
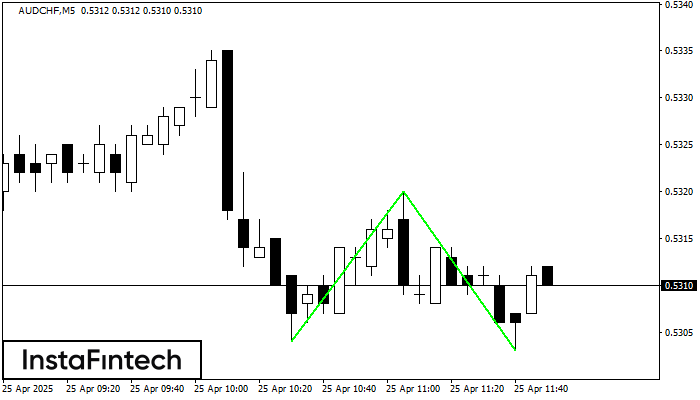
Corak Double Bottom telah dibentuk pada AUDCHF M5. Ciri-ciri: tahap sokongan 0.5304; tahap rintangan 0.5320; lebar corak 16 mata. Sekiranya tahap rintangan ditembusi, perubahan aliran boleh diramalkan dengan titik sasaran
Carta masa M5 dan M15 mungkin mempunyai lebih banyak titik kemasukan palsu.
Open chart in a new window


