

Corak sebenar

Double Top
was formed on 14.04 at 11:20:29 (UTC+0)
signal strength 1 of 5
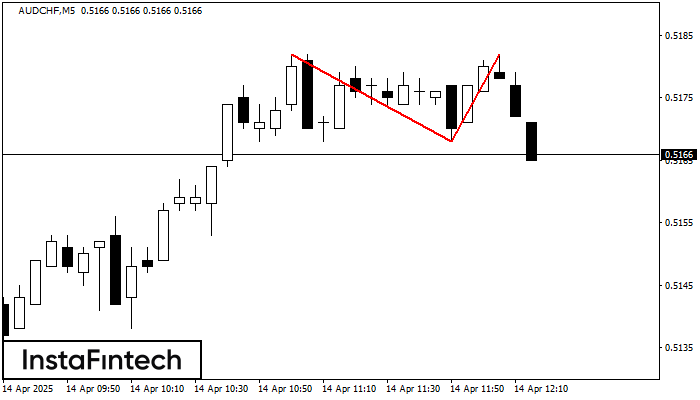
The Double Top pattern has been formed on AUDCHF M5. It signals that the trend has been changed from upwards to downwards. Probably, if the base of the pattern 0.5168 is broken, the downward movement will continue.
The M5 and M15 time frames may have more false entry points.
Juga lihat
- All
- All
- Bearish Rectangle
- Bearish Symmetrical Triangle
- Bearish Symmetrical Triangle
- Bullish Rectangle
- Double Top
- Double Top
- Triple Bottom
- Triple Bottom
- Triple Top
- Triple Top
- All
- All
- Buy
- Sale
- All
- 1
- 2
- 3
- 4
- 5
Double Top
was formed on 03.06 at 01:35:08 (UTC+0)
signal strength 1 of 5
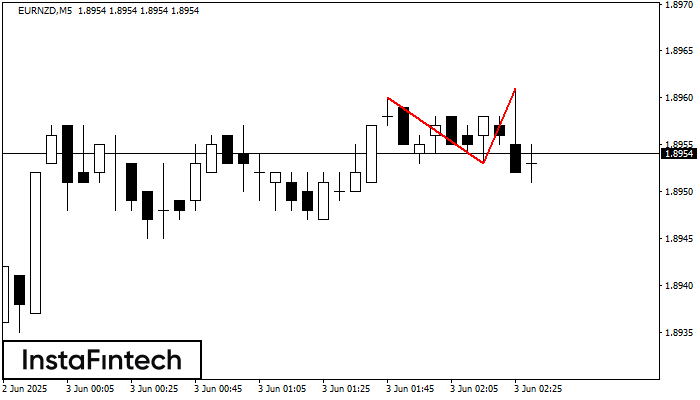
Pada carta EURNZD M5 corak pembalikan Double Top telah terbentuk. Ciri-ciri: sempadan atas 1.8961; sempadan bawah 1.8953; lebar corak 8 mata. Isyarat: penembusan sempadan bawah akan menyebabkan kesinambungan arah aliran
Carta masa M5 dan M15 mungkin mempunyai lebih banyak titik kemasukan palsu.
Open chart in a new window
Triple Top
was formed on 03.06 at 00:30:20 (UTC+0)
signal strength 3 of 5
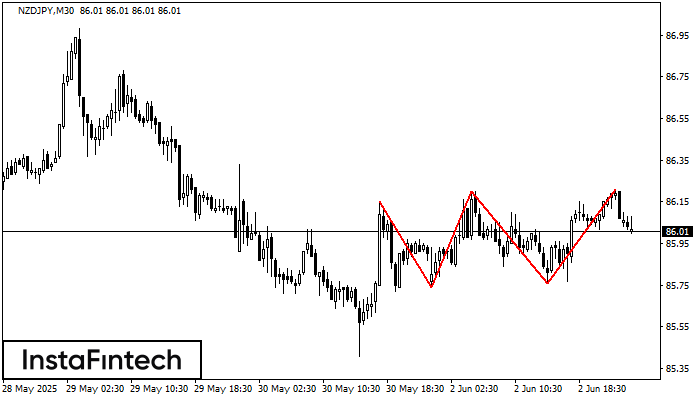
Corak Triple Top telah dibentuk pada carta NZDJPY M30. Ciri corak: sempadan mempunyai sudut menaik; garisan bawah corak mempunyai koordinat 85.74/85.76 dengan had atas 86.15/86.21; unjuran lebar ialah 41 mata
Open chart in a new window
Triple Bottom
was formed on 03.06 at 00:05:20 (UTC+0)
signal strength 1 of 5

Corak Triple Bottom telah dibentuk pada carta USDJPY M5. Ciri-ciri corak: Garisan bawah corak mempunyai koordinat 142.75 dengan had atas 142.75/142.69, unjuran lebar adalah 7 mata. Pembentukan corak Triple Bottom
Carta masa M5 dan M15 mungkin mempunyai lebih banyak titik kemasukan palsu.
Open chart in a new window


