

Corak sebenar

Bullish Symmetrical Triangle
was formed on 14.04 at 04:00:58 (UTC+0)
signal strength 4 of 5

According to the chart of H1, EURNZD formed the Bullish Symmetrical Triangle pattern. Description: This is the pattern of a trend continuation. 2.0005 and 1.9118 are the coordinates of the upper and lower borders respectively. The pattern width is measured on the chart at 887 pips. Outlook: If the upper border 2.0005 is broken, the price is likely to continue its move by 1.9525.
- All
- All
- Bearish Rectangle
- Bearish Symmetrical Triangle
- Bearish Symmetrical Triangle
- Bullish Rectangle
- Double Top
- Double Top
- Triple Bottom
- Triple Bottom
- Triple Top
- Triple Top
- All
- All
- Buy
- Sale
- All
- 1
- 2
- 3
- 4
- 5
Bearish Symmetrical Triangle
was formed on 15.05 at 23:00:07 (UTC+0)
signal strength 1 of 5
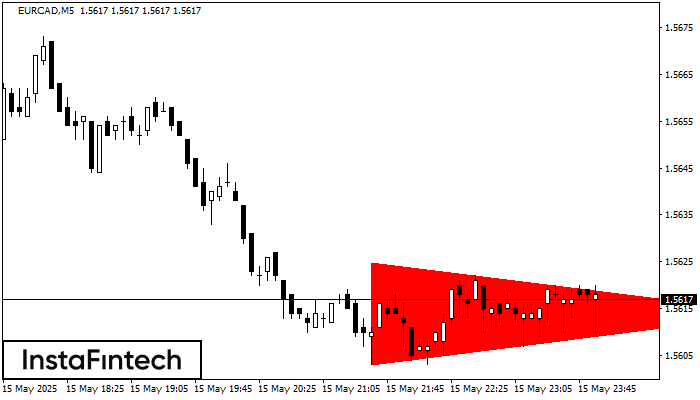
According to the chart of M5, EURCAD formed the Bearish Symmetrical Triangle pattern. Trading recommendations: A breach of the lower border 1.5603 is likely to encourage a continuation
The M5 and M15 time frames may have more false entry points.
Open chart in a new window
Bearish Rectangle
was formed on 15.05 at 22:58:25 (UTC+0)
signal strength 1 of 5
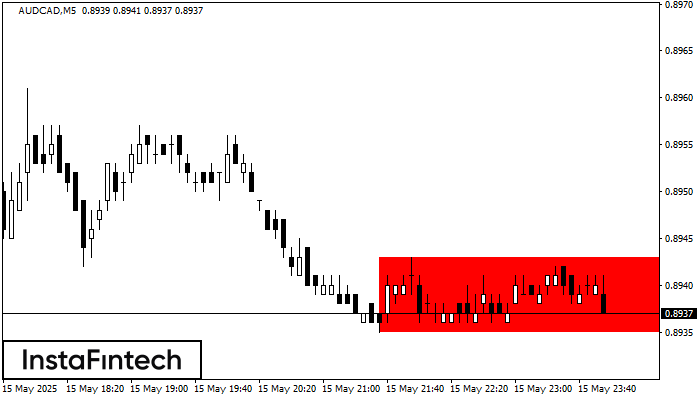
According to the chart of M5, AUDCAD formed the Bearish Rectangle. This type of a pattern indicates a trend continuation. It consists of two levels: resistance 0.8943 - 0.0000
The M5 and M15 time frames may have more false entry points.
Open chart in a new window
Triple Bottom
was formed on 15.05 at 22:30:23 (UTC+0)
signal strength 2 of 5
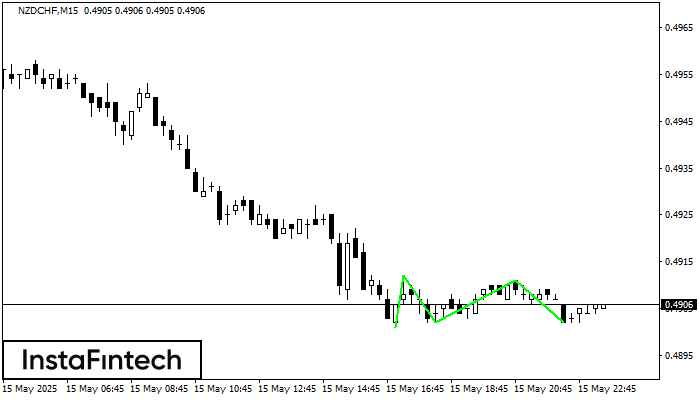
The Triple Bottom pattern has been formed on NZDCHF M15. It has the following characteristics: resistance level 0.4912/0.4911; support level 0.4901/0.4902; the width is 11 points. In the event
The M5 and M15 time frames may have more false entry points.
Open chart in a new window


