

Corak sebenar

Triple Top
was formed on 14.04 at 00:30:50 (UTC+0)
signal strength 2 of 5
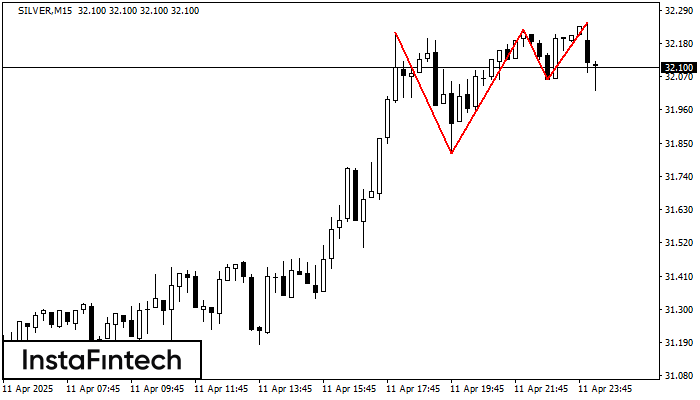
On the chart of the SILVER M15 trading instrument, the Triple Top pattern that signals a trend change has formed. It is possible that after formation of the third peak, the price will try to break through the resistance level 31.82, where we advise to open a trading position for sale. Take profit is the projection of the pattern’s width, which is 400 points.
The M5 and M15 time frames may have more false entry points.
- All
- All
- Bearish Rectangle
- Bearish Symmetrical Triangle
- Bearish Symmetrical Triangle
- Bullish Rectangle
- Double Top
- Double Top
- Triple Bottom
- Triple Bottom
- Triple Top
- Triple Top
- All
- All
- Buy
- Sale
- All
- 1
- 2
- 3
- 4
- 5
Double Bottom
was formed on 05.06 at 15:00:20 (UTC+0)
signal strength 4 of 5
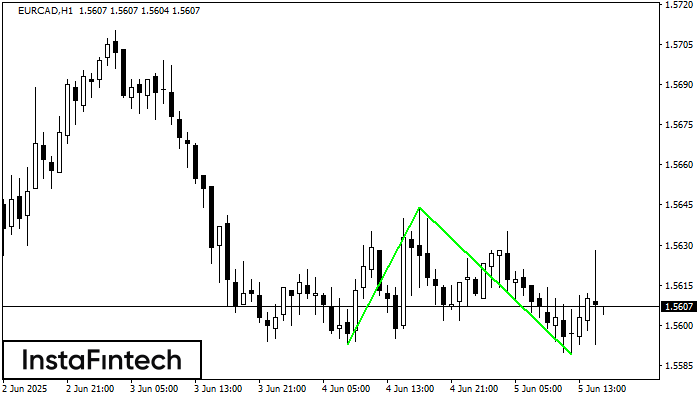
The Double Bottom pattern has been formed on EURCAD H1; the upper boundary is 1.5644; the lower boundary is 1.5589. The width of the pattern is 51 points. In case
Open chart in a new window
Double Top
was formed on 05.06 at 14:30:23 (UTC+0)
signal strength 2 of 5
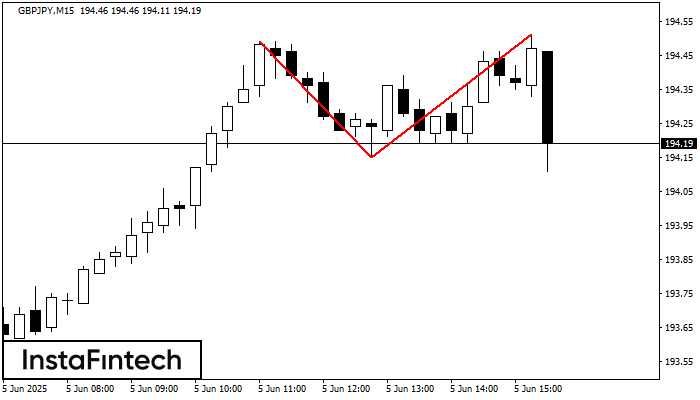
The Double Top reversal pattern has been formed on GBPJPY M15. Characteristics: the upper boundary 194.49; the lower boundary 194.15; the width of the pattern is 36 points. Sell trades
The M5 and M15 time frames may have more false entry points.
Open chart in a new window
Bullish Symmetrical Triangle
was formed on 05.06 at 14:16:35 (UTC+0)
signal strength 1 of 5
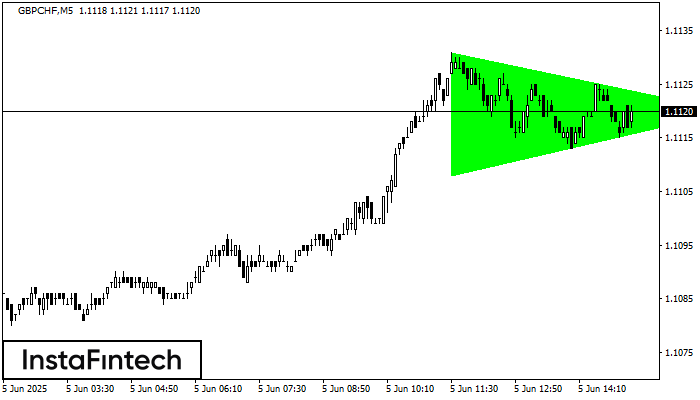
According to the chart of M5, GBPCHF formed the Bullish Symmetrical Triangle pattern. The lower border of the pattern touches the coordinates 1.1108/1.1120 whereas the upper border goes across 1.1131/1.1120
The M5 and M15 time frames may have more false entry points.
Open chart in a new window


