

Corak sebenar

Double Bottom
was formed on 11.04 at 11:59:58 (UTC+0)
signal strength 3 of 5
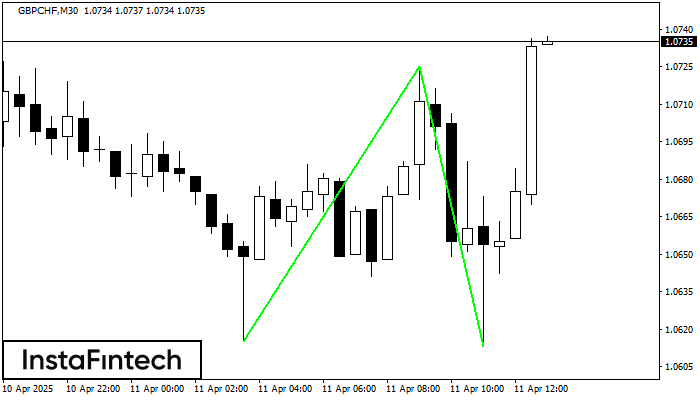
The Double Bottom pattern has been formed on GBPCHF M30; the upper boundary is 1.0725; the lower boundary is 1.0613. The width of the pattern is 110 points. In case of a break of the upper boundary 1.0725, a change in the trend can be predicted where the width of the pattern will coincide with the distance to a possible take profit level.
Juga lihat
- All
- All
- Bearish Rectangle
- Bearish Symmetrical Triangle
- Bearish Symmetrical Triangle
- Bullish Rectangle
- Double Top
- Double Top
- Triple Bottom
- Triple Bottom
- Triple Top
- Triple Top
- All
- All
- Buy
- Sale
- All
- 1
- 2
- 3
- 4
- 5
Triple Bottom
was formed on 25.05 at 15:59:45 (UTC+0)
signal strength 4 of 5

Corak Triple Bottom telah dibentuk pada carta bagi instrumen dagangan #Bitcoin H1. Corak menandakan perubahan aliran dari menurun ke aliran menaik dalam sekiranya penembusan 109440.14/108246.73
Open chart in a new window
Double Bottom
was formed on 25.05 at 12:20:13 (UTC+0)
signal strength 1 of 5

Corak Double Bottom telah dibentuk pada #Bitcoin M5. Ciri-ciri: tahap sokongan 106888.42; tahap rintangan 107214.56; lebar corak 32614 mata. Sekiranya tahap rintangan ditembusi, perubahan aliran boleh diramalkan dengan titik sasaran
Carta masa M5 dan M15 mungkin mempunyai lebih banyak titik kemasukan palsu.
Open chart in a new window
Segi Empat Menaik
was formed on 25.05 at 07:55:30 (UTC+0)
signal strength 1 of 5

Berdasarkan carta M5, #Bitcoin telah membentuk Segi Empat Menaik yang merupakan corak kesinambungan aliran. Corak adalah terkandung dalam sempadan berikut: sempadan bawah 107891.05 – 107891.05 dan sempadan atas 108246.73 –
Carta masa M5 dan M15 mungkin mempunyai lebih banyak titik kemasukan palsu.
Open chart in a new window


