

Corak sebenar

Triple Top
was formed on 11.04 at 06:30:13 (UTC+0)
signal strength 3 of 5
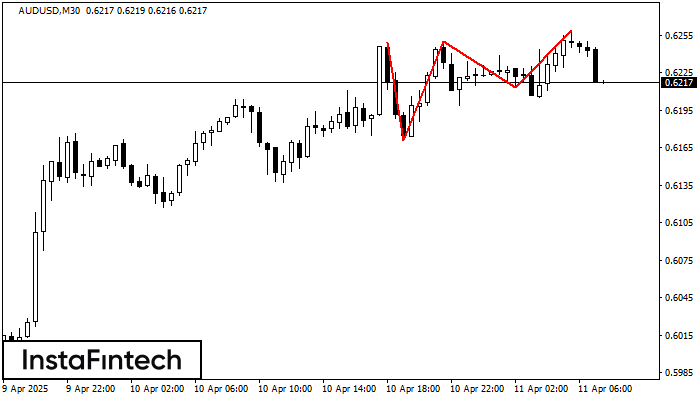
On the chart of the AUDUSD M30 trading instrument, the Triple Top pattern that signals a trend change has formed. It is possible that after formation of the third peak, the price will try to break through the resistance level 0.6171, where we advise to open a trading position for sale. Take profit is the projection of the pattern’s width, which is 78 points.
- All
- All
- Bearish Rectangle
- Bearish Symmetrical Triangle
- Bearish Symmetrical Triangle
- Bullish Rectangle
- Double Top
- Double Top
- Triple Bottom
- Triple Bottom
- Triple Top
- Triple Top
- All
- All
- Buy
- Sale
- All
- 1
- 2
- 3
- 4
- 5
Triple Top
was formed on 03.06 at 00:30:20 (UTC+0)
signal strength 3 of 5
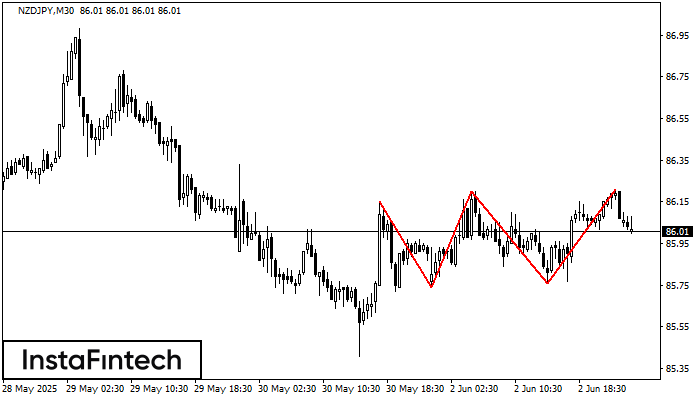
The Triple Top pattern has formed on the chart of the NZDJPY M30. Features of the pattern: borders have an ascending angle; the lower line of the pattern
Open chart in a new window
Triple Bottom
was formed on 03.06 at 00:05:20 (UTC+0)
signal strength 1 of 5

The Triple Bottom pattern has formed on the chart of USDJPY M5. Features of the pattern: The lower line of the pattern has coordinates 142.75 with the upper limit 142.75/142.69
The M5 and M15 time frames may have more false entry points.
Open chart in a new window
Triple Bottom
was formed on 03.06 at 00:00:22 (UTC+0)
signal strength 3 of 5
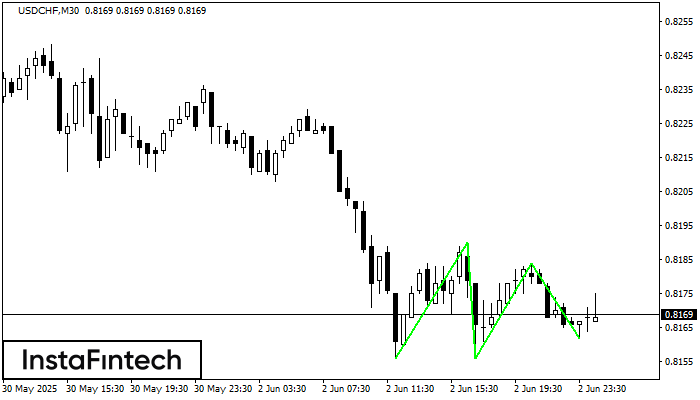
The Triple Bottom pattern has formed on the chart of the USDCHF M30 trading instrument. The pattern signals a change in the trend from downwards to upwards in the case
Open chart in a new window

