

Corak sebenar

Bullish Symmetrical Triangle
was formed on 10.04 at 19:35:35 (UTC+0)
signal strength 1 of 5
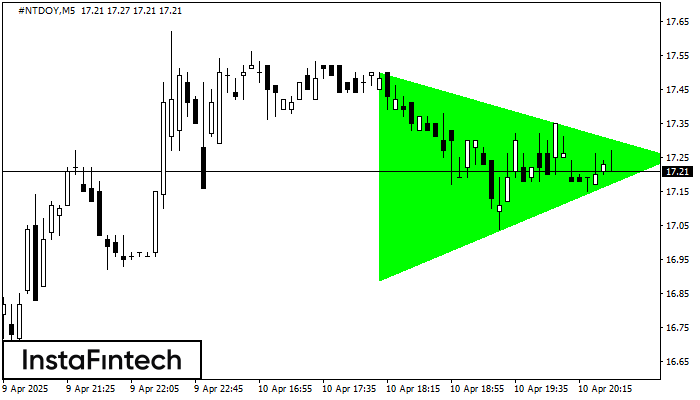
According to the chart of M5, #NTDOY formed the Bullish Symmetrical Triangle pattern. Description: This is the pattern of a trend continuation. 17.50 and 16.89 are the coordinates of the upper and lower borders respectively. The pattern width is measured on the chart at 61 pips. Outlook: If the upper border 17.50 is broken, the price is likely to continue its move by 17.40.
The M5 and M15 time frames may have more false entry points.
- All
- All
- Bearish Rectangle
- Bearish Symmetrical Triangle
- Bearish Symmetrical Triangle
- Bullish Rectangle
- Double Top
- Double Top
- Triple Bottom
- Triple Bottom
- Triple Top
- Triple Top
- All
- All
- Buy
- Sale
- All
- 1
- 2
- 3
- 4
- 5
Double Bottom
was formed on 02.06 at 05:25:31 (UTC+0)
signal strength 1 of 5
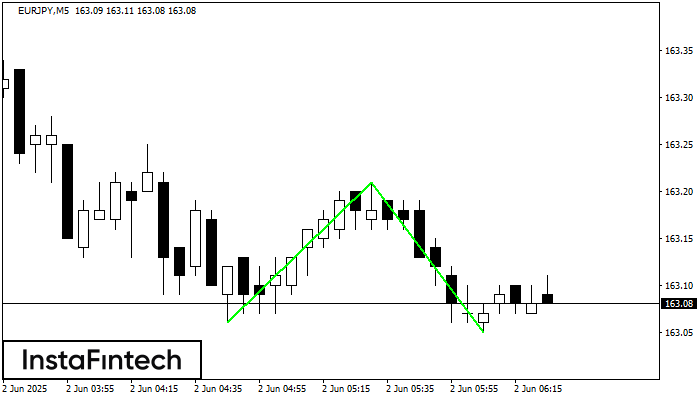
The Double Bottom pattern has been formed on EURJPY M5; the upper boundary is 163.21; the lower boundary is 163.05. The width of the pattern is 15 points. In case
The M5 and M15 time frames may have more false entry points.
Open chart in a new window
Bullish Symmetrical Triangle
was formed on 02.06 at 05:21:10 (UTC+0)
signal strength 1 of 5
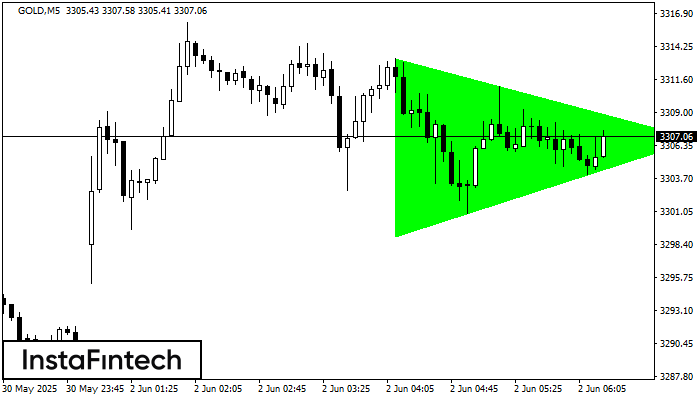
According to the chart of M5, GOLD formed the Bullish Symmetrical Triangle pattern, which signals the trend will continue. Description. The upper border of the pattern touches the coordinates 3313.29/3306.86
The M5 and M15 time frames may have more false entry points.
Open chart in a new window
Double Bottom
was formed on 02.06 at 05:00:29 (UTC+0)
signal strength 4 of 5
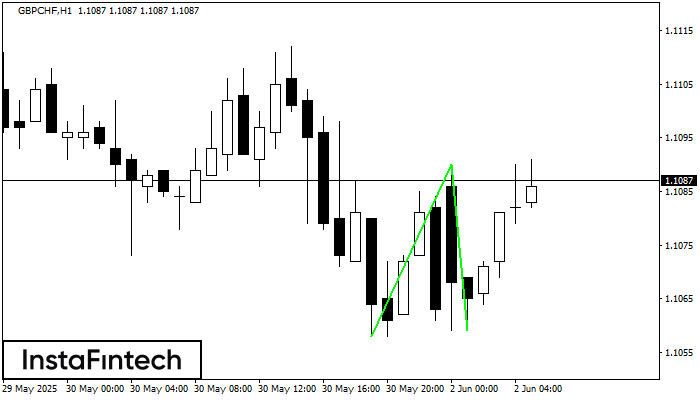
The Double Bottom pattern has been formed on GBPCHF H1. This formation signals a reversal of the trend from downwards to upwards. The signal is that a buy trade should
Open chart in a new window

