

Corak sebenar

Double Top
was formed on 10.04 at 15:00:21 (UTC+0)
signal strength 2 of 5
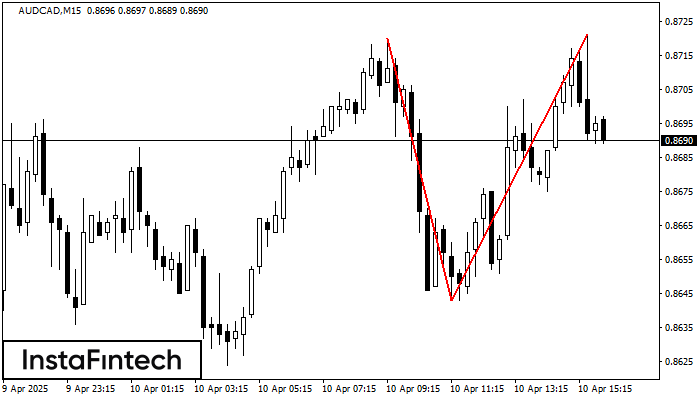
On the chart of AUDCAD M15 the Double Top reversal pattern has been formed. Characteristics: the upper boundary 0.8721; the lower boundary 0.8643; the width of the pattern 78 points. The signal: a break of the lower boundary will cause continuation of the downward trend targeting the 0.8620 level.
The M5 and M15 time frames may have more false entry points.
Juga lihat
- All
- All
- Bearish Rectangle
- Bearish Symmetrical Triangle
- Bearish Symmetrical Triangle
- Bullish Rectangle
- Double Top
- Double Top
- Triple Bottom
- Triple Bottom
- Triple Top
- Triple Top
- All
- All
- Buy
- Sale
- All
- 1
- 2
- 3
- 4
- 5
ডাবল টপ
was formed on 20.05 at 20:45:15 (UTC+0)
signal strength 2 of 5

M15 চার্টে, #TSLA-এর ডাবল টপ প্যাটার্নটি গঠিত হয়েছে। এটি এই ইঙ্গিত দেয় যে চলমান প্রবণতা ঊর্ধ্বমুখী থেকে নিম্নমুখীতে পরিবর্তিত হয়েছে। সম্ভবত, যদি 348.76 প্যাটার্নের ভিত্তিটি ব্রেক করা হয়, তাহলে নিম্নমুখী
M5 এবং M15 টাইম ফ্রেমে আরও ভুল এন্ট্রি পয়েন্ট থাকতে পারে।
Open chart in a new window
ডাবল টপ
was formed on 20.05 at 20:45:03 (UTC+0)
signal strength 2 of 5
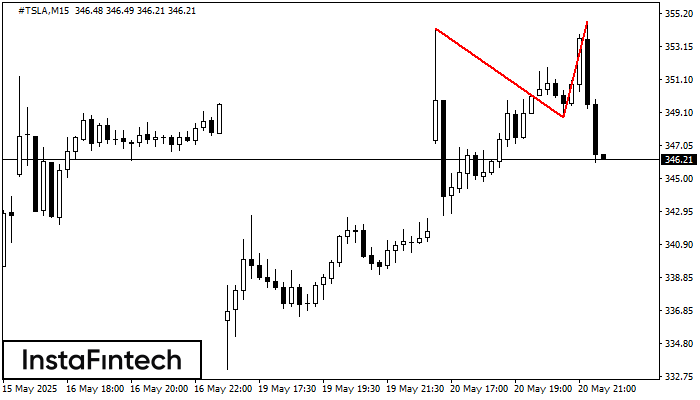
M15 চার্টে, #TSLA-এর ডাবল টপ রিভার্সাল বা বিপরীতমুখী প্যাটার্ন গঠিত হয়েছে। বৈশিষ্ট্য: উপরের সীমানা 354.27; নীচের সীমানা 348.76; প্যাটার্নের প্রস্থ হল 593 পয়েন্ট। 348.76 348.54 স্তরের দিকে সম্ভাব্য মুভমেন্টের সাথে
M5 এবং M15 টাইম ফ্রেমে আরও ভুল এন্ট্রি পয়েন্ট থাকতে পারে।
Open chart in a new window
ডাবল টপ
was formed on 20.05 at 20:30:15 (UTC+0)
signal strength 1 of 5
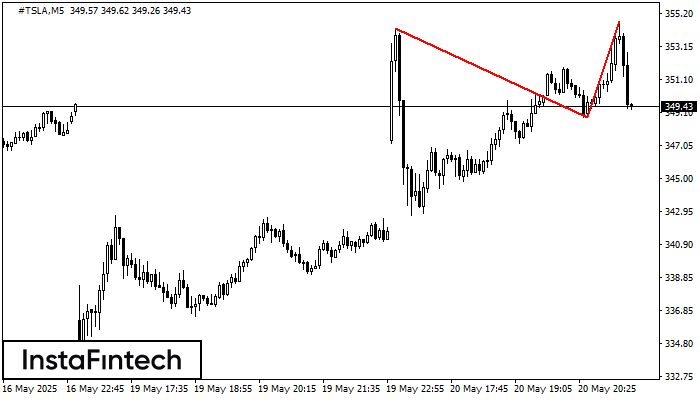
M5 চার্টে, #TSLA-এর ডাবল টপ প্যাটার্নটি গঠিত হয়েছে। এটি এই ইঙ্গিত দেয় যে চলমান প্রবণতা ঊর্ধ্বমুখী থেকে নিম্নমুখীতে পরিবর্তিত হয়েছে। সম্ভবত, যদি 348.76 প্যাটার্নের ভিত্তিটি ব্রেক করা হয়, তাহলে নিম্নমুখী
M5 এবং M15 টাইম ফ্রেমে আরও ভুল এন্ট্রি পয়েন্ট থাকতে পারে।
Open chart in a new window


