

Corak sebenar

Double Bottom
was formed on 10.04 at 13:30:17 (UTC+0)
signal strength 2 of 5
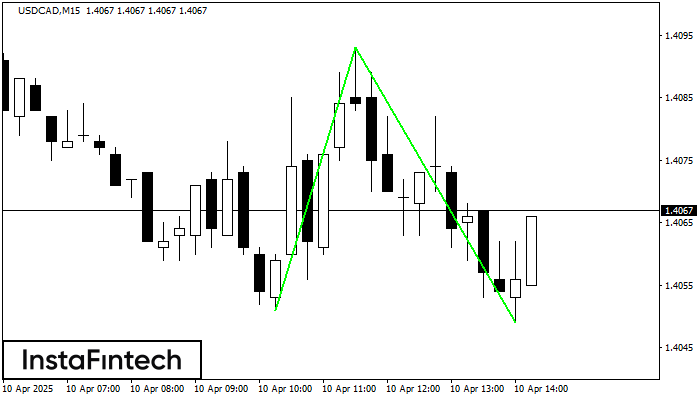
The Double Bottom pattern has been formed on USDCAD M15; the upper boundary is 1.4093; the lower boundary is 1.4049. The width of the pattern is 42 points. In case of a break of the upper boundary 1.4093, a change in the trend can be predicted where the width of the pattern will coincide with the distance to a possible take profit level.
The M5 and M15 time frames may have more false entry points.
Juga lihat
- All
- All
- Bearish Rectangle
- Bearish Symmetrical Triangle
- Bearish Symmetrical Triangle
- Bullish Rectangle
- Double Top
- Double Top
- Triple Bottom
- Triple Bottom
- Triple Top
- Triple Top
- All
- All
- Buy
- Sale
- All
- 1
- 2
- 3
- 4
- 5
Double Bottom
was formed on 26.11 at 11:00:18 (UTC+0)
signal strength 4 of 5
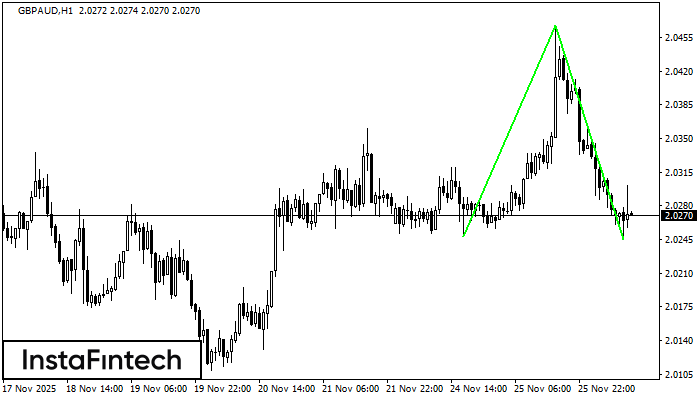
The Double Bottom pattern has been formed on GBPAUD H1; the upper boundary is 2.0468; the lower boundary is 2.0245. The width of the pattern is 220 points. In case
Open chart in a new window
Double Bottom
was formed on 26.11 at 10:30:23 (UTC+0)
signal strength 3 of 5
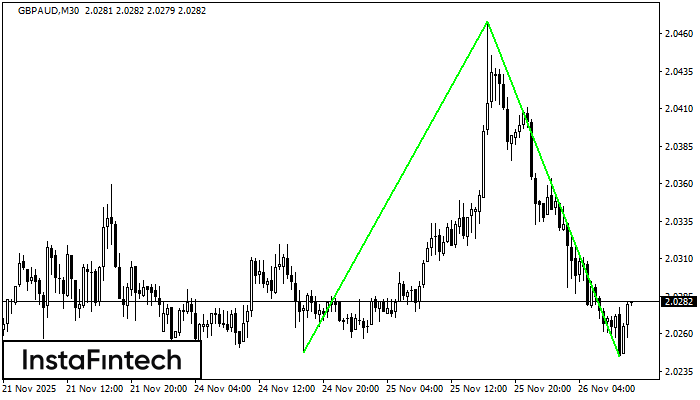
The Double Bottom pattern has been formed on GBPAUD M30. Characteristics: the support level 2.0248; the resistance level 2.0468; the width of the pattern 220 points. If the resistance level
Open chart in a new window
Double Bottom
was formed on 26.11 at 10:15:25 (UTC+0)
signal strength 2 of 5
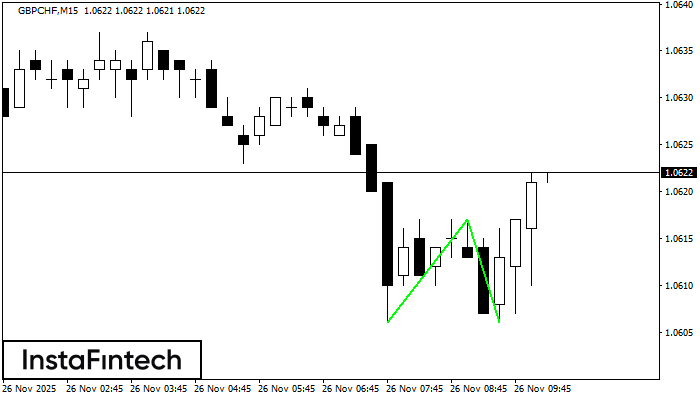
The Double Bottom pattern has been formed on GBPCHF M15; the upper boundary is 1.0617; the lower boundary is 1.0606. The width of the pattern is 11 points. In case
The M5 and M15 time frames may have more false entry points.
Open chart in a new window


