

Corak sebenar

Bearish Flag
was formed on 10.04 at 02:58:24 (UTC+0)
signal strength 1 of 5
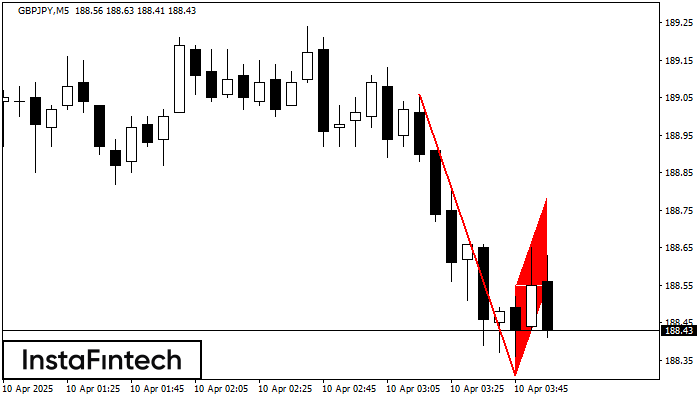
The Bearish Flag pattern has been formed on the chart GBPJPY M5. Therefore, the downwards trend is likely to continue in the nearest term. As soon as the price breaks below the low at 188.31, traders should enter the market.
The M5 and M15 time frames may have more false entry points.
Juga lihat
- All
- All
- Bearish Rectangle
- Bearish Symmetrical Triangle
- Bearish Symmetrical Triangle
- Bullish Rectangle
- Double Top
- Double Top
- Triple Bottom
- Triple Bottom
- Triple Top
- Triple Top
- All
- All
- Buy
- Sale
- All
- 1
- 2
- 3
- 4
- 5
Head and Shoulders
was formed on 29.05 at 09:45:24 (UTC+0)
signal strength 1 of 5
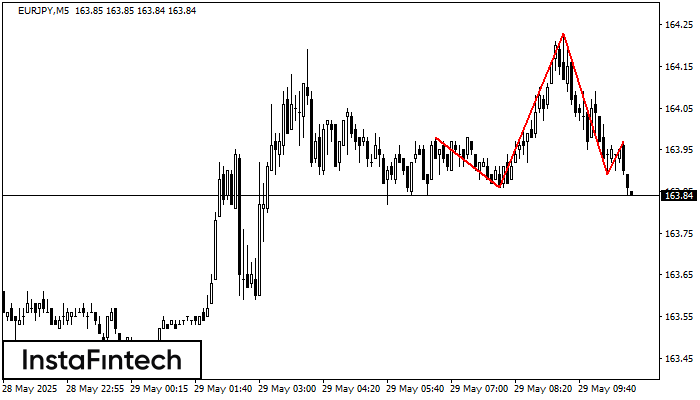
According to the chart of M5, EURJPY formed the Head and Shoulders pattern. The Head’s top is set at 164.23 while the median line of the Neck is found
The M5 and M15 time frames may have more false entry points.
Open chart in a new window
Double Top
was formed on 29.05 at 09:30:03 (UTC+0)
signal strength 3 of 5
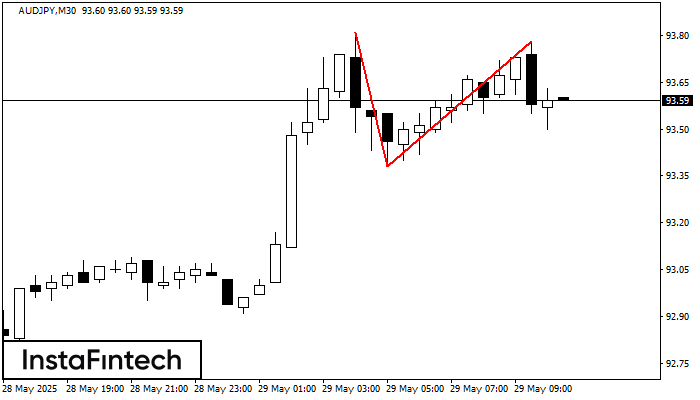
The Double Top pattern has been formed on AUDJPY M30. It signals that the trend has been changed from upwards to downwards. Probably, if the base of the pattern 93.38
Open chart in a new window
Double Top
was formed on 29.05 at 09:15:11 (UTC+0)
signal strength 2 of 5
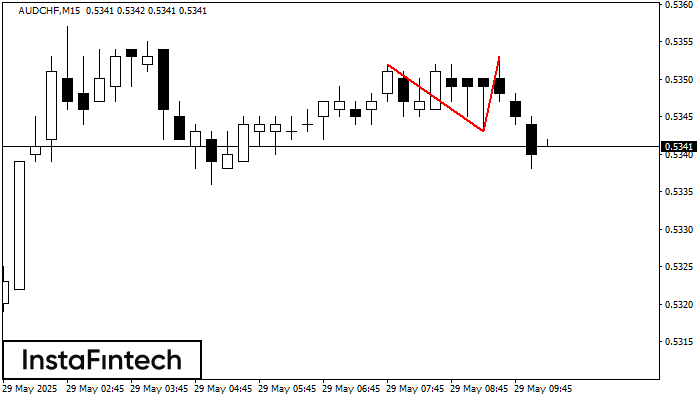
The Double Top pattern has been formed on AUDCHF M15. It signals that the trend has been changed from upwards to downwards. Probably, if the base of the pattern 0.5343
The M5 and M15 time frames may have more false entry points.
Open chart in a new window


