

Corak sebenar

Bullish Symmetrical Triangle
was formed on 10.04 at 02:15:14 (UTC+0)
signal strength 2 of 5
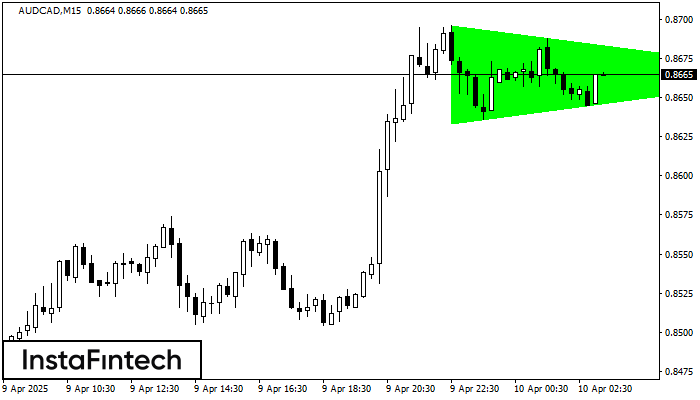
According to the chart of M15, AUDCAD formed the Bullish Symmetrical Triangle pattern, which signals the trend will continue. Description. The upper border of the pattern touches the coordinates 0.8696/0.8665 whereas the lower border goes across 0.8633/0.8665. The pattern width is measured on the chart at 63 pips. If the Bullish Symmetrical Triangle pattern is in progress during the upward trend, this indicates the current trend will go on. In case 0.8665 is broken, the price could continue its move toward 0.8687.
The M5 and M15 time frames may have more false entry points.
Juga lihat
- All
- All
- Bearish Rectangle
- Bearish Symmetrical Triangle
- Bearish Symmetrical Triangle
- Bullish Rectangle
- Double Top
- Double Top
- Triple Bottom
- Triple Bottom
- Triple Top
- Triple Top
- All
- All
- Buy
- Sale
- All
- 1
- 2
- 3
- 4
- 5
Teratas Triple
was formed on 01.06 at 02:15:04 (UTC+0)
signal strength 2 of 5

Pada grafik instrumen trading #Bitcoin M15, pola Teratas Triple yang menandakan perubahan trend telah terbentuk. Ada kemungkinan bahwa setelah pembentukan puncak (peak) ketiga, harga akan mencoba untuk menembus level resistance
Rangka waktu M5 dan M15 mungkin memiliki lebih dari titik entri yang keliru.
Open chart in a new window
Teratas Ganda
was formed on 01.06 at 01:00:35 (UTC+0)
signal strength 3 of 5

Pola reversal Teratas Ganda telah terbentuk pada #Bitcoin M30. Karakteristik: batas atas 104800.13; batas bawah 104215.56; lebar pola 64024 poin. Transaksi jual lebih baik dibuka di bawah batas bawah 104215.56
Open chart in a new window
Persegi Bullish
was formed on 31.05 at 19:15:46 (UTC+0)
signal strength 1 of 5

Menurut grafik dari M5, #Bitcoin terbentuk Persegi Bullish yang merupakan pola dari kelanjutan tren. Pola terkandung dalam batas berikut: batas yang lebih rendah 104335.43 – 104335.43 dan batas atas 104800.13
Rangka waktu M5 dan M15 mungkin memiliki lebih dari titik entri yang keliru.
Open chart in a new window


