

Corak sebenar

Bearish Symmetrical Triangle
was formed on 09.04 at 16:55:24 (UTC+0)
signal strength 3 of 5
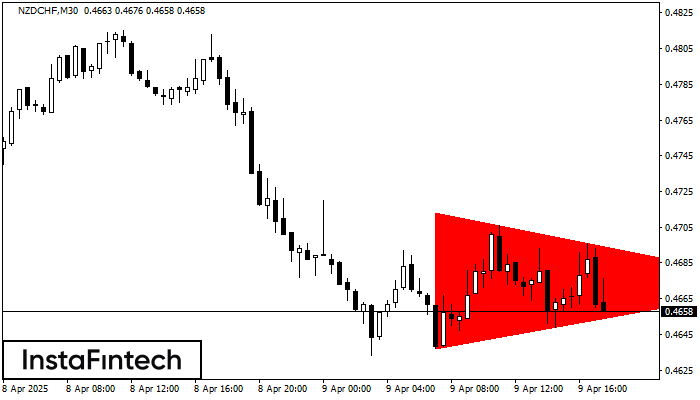
According to the chart of M30, NZDCHF formed the Bearish Symmetrical Triangle pattern. Description: The lower border is 0.4637/0.4673 and upper border is 0.4713/0.4673. The pattern width is measured on the chart at -76 pips. The formation of the Bearish Symmetrical Triangle pattern evidently signals a continuation of the downward trend. In other words, if the scenario comes true and NZDCHF breaches the lower border, the price could continue its move toward 0.4643.
- All
- All
- Bearish Rectangle
- Bearish Symmetrical Triangle
- Bearish Symmetrical Triangle
- Bullish Rectangle
- Double Top
- Double Top
- Triple Bottom
- Triple Bottom
- Triple Top
- Triple Top
- All
- All
- Buy
- Sale
- All
- 1
- 2
- 3
- 4
- 5
बियरिश आयत
was formed on 29.05 at 10:50:07 (UTC+0)
signal strength 1 of 5
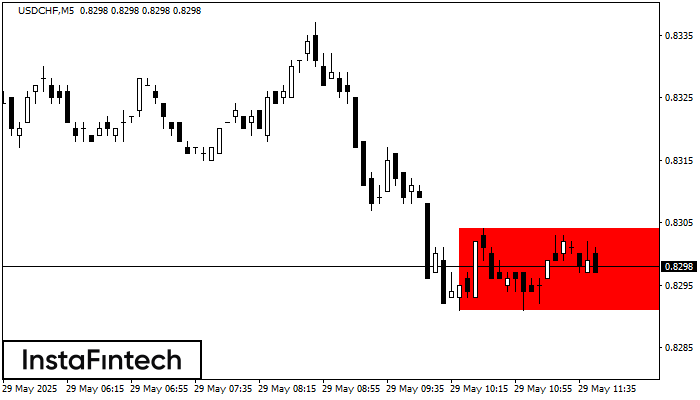
M5 के चार्ट के अनुसार, USDCHF से बियरिश आयत बना। इस प्रकार का पैटर्न एक प्रवृत्ति निरंतरता को इंगित करता है। इसमें दो स्तर होते हैं: प्रतिरोध 0.8304 - 0.0000
M5 और M15 समय सीमा में अधिक फाल्स एंट्री पॉइंट्स हो सकते हैं।
Open chart in a new window
डबल बॉटम
was formed on 29.05 at 10:20:05 (UTC+0)
signal strength 1 of 5
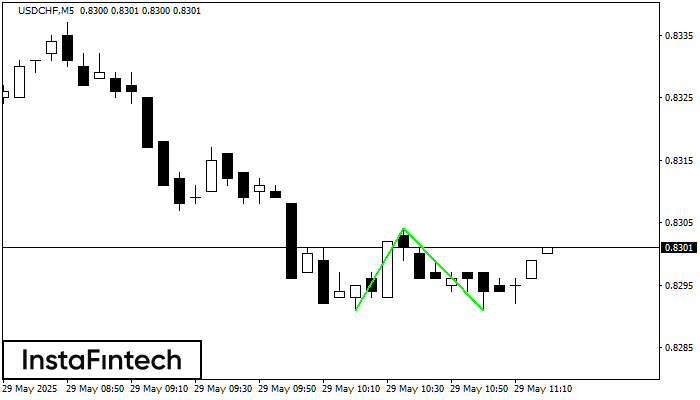
डबल बॉटम पैटर्न USDCHF M5 पर बना है; ऊपरी सीमा 0.8304 है; निचली सीमा 0.8291 है। पैटर्न की चौड़ाई 13 अंक है। ऊपरी सीमा 0.8304 के टूटने के मामले में
M5 और M15 समय सीमा में अधिक फाल्स एंट्री पॉइंट्स हो सकते हैं।
Open chart in a new window
हेड एण्ड शोल्डर्स
was formed on 29.05 at 09:45:24 (UTC+0)
signal strength 1 of 5
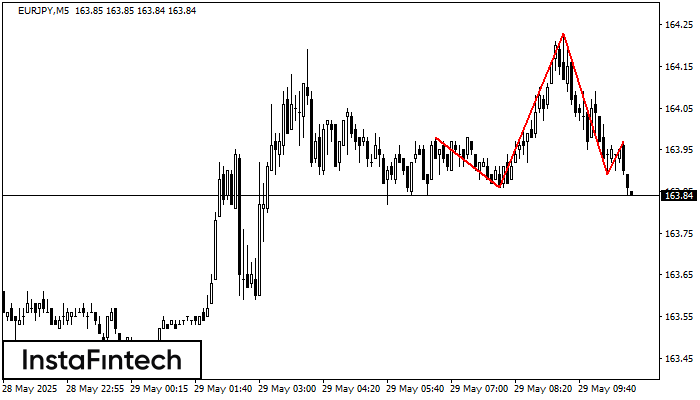
M5 के चार्ट के अनुसार, EURJPY से हेड एण्ड शोल्डर्स पैटर्न बना। हेड का टॉप 164.23 पर सेट है जबकि नेक की मध्य रेखा 163.86/163.89 पर मौजूद है। हेड एण्ड
M5 और M15 समय सीमा में अधिक फाल्स एंट्री पॉइंट्स हो सकते हैं।
Open chart in a new window


