

Corak sebenar

Bullish Flag
was formed on 09.04 at 08:53:25 (UTC+0)
signal strength 1 of 5
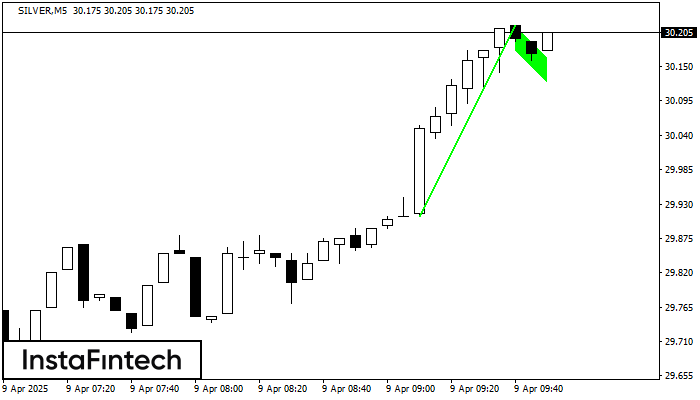
The Bullish Flag pattern has been formed on the chart SILVER M5 which signals that the upward trend will continue. Signals: а break of the peak at 30.21 may push the price higher, and the rise will be the projection of the pole.
The M5 and M15 time frames may have more false entry points.
- All
- All
- Bearish Rectangle
- Bearish Symmetrical Triangle
- Bearish Symmetrical Triangle
- Bullish Rectangle
- Double Top
- Double Top
- Triple Bottom
- Triple Bottom
- Triple Top
- Triple Top
- All
- All
- Buy
- Sale
- All
- 1
- 2
- 3
- 4
- 5
Бычий симметричный треугольник
сформирован 24.05 в 18:46:25 (UTC+0)
сила сигнала 2 из 5

По #Bitcoin на M15 сформировалась фигура «Бычий симметричный треугольник», которая сигнализирует нам о продолжении тенденции. Характеристика: Верхняя граница фигуры имеет координаты 109440.14/108872.57; Нижняя граница 108311.13/108872.57; Проекция ширины фигуры 112901 пунктов
Таймфреймы М5 и М15 могут иметь больше ложных точек входа.
Открыть график инструмента в новом окне
Прямоугольник
сформирован 23.05 в 23:00:20 (UTC+0)
сила сигнала 1 из 5

Сформирована фигура «Прямоугольник» на графике EURNZD M5. Тип фигуры: Продолжение тренда; Границы: Верхняя 1.8982, Нижняя 1.8964; Сигнал: позиция на продажу открывается после фиксации цены ниже границы прямоугольника 1.8964
Таймфреймы М5 и М15 могут иметь больше ложных точек входа.
Открыть график инструмента в новом окне
Бычий симметричный треугольник
сформирован 23.05 в 22:14:53 (UTC+0)
сила сигнала 1 из 5

По AUDCHF на M5 фигура «Бычий симметричный треугольник». Характеристика: Фигура продолжения тренда; Координаты границ – верхняя 0.5335, нижняя 0.5329. Проекция ширины фигуры 6 пунктов. Прогноз: В случае пробоя верхней границы
Таймфреймы М5 и М15 могут иметь больше ложных точек входа.
Открыть график инструмента в новом окне


