

Corak sebenar

Inverse Head and Shoulder
was formed on 09.04 at 04:04:54 (UTC+0)
signal strength 1 of 5

According to the chart of M5, NZDCAD formed the Inverse Head and Shoulder pattern. The Head’s top is set at 0.7878 while the median line of the Neck is found at 0.7826/0.7858. The formation of the Inverse Head and Shoulder pattern evidently signals a reversal of the downward trend. In other words, in case the scenario comes true, the price of NZDCAD will go towards 0.7893
The M5 and M15 time frames may have more false entry points.
- All
- All
- Bearish Rectangle
- Bearish Symmetrical Triangle
- Bearish Symmetrical Triangle
- Bullish Rectangle
- Double Top
- Double Top
- Triple Bottom
- Triple Bottom
- Triple Top
- Triple Top
- All
- All
- Buy
- Sale
- All
- 1
- 2
- 3
- 4
- 5
รูปแบบกราฟธงปลายแหลมขาลง (Bearish pennant)
was formed on 26.05 at 00:19:29 (UTC+0)
signal strength 1 of 5
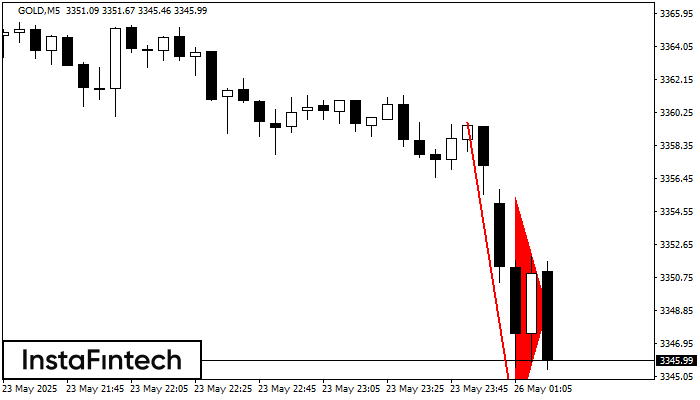
รูปแบบ รูปแบบกราฟธงปลายแหลมขาลง (Bearish pennant) ได้สร้างขึ้นมาในชาร์ต GOLD M5 รูปแบบนี้แสดงถึงความต่องเนื่องของแนวโน้มขาลง กรณีที่มีการเคลื่อนตัวทะลุผ่านของระดับต่ำในรูปธงปลายแหลมที่ 3342.42 ออกไป คำแนะนำ: กำหนดคำสั่งซื้อขายล่วงหน้า(pending order)
ขอบเตระยะเวลาใน M5 และ M15 อาจจะมีตำแหน่งการเข้าใช้งานที่ผิดพลาดมากยิ่งขึ้น
Open chart in a new window
รูปแบบกราฟสี่เหลี่ยมผืนผ้าขาขึ้น (Bullish Rectangle)
was formed on 25.05 at 23:51:24 (UTC+0)
signal strength 1 of 5
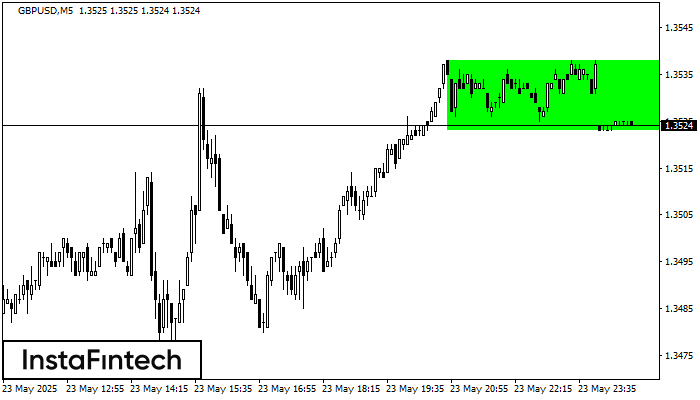
อ้างอิงจากชาร์ตของ M5, GBPUSD ที่ได้สร้างรูปแบบ รูปแบบกราฟสี่เหลี่ยมผืนผ้าขาขึ้น (Bullish Rectangle) ออกมา ซึ่งเป็นรูปแบบของความต่อเนื่องในแนวโน้ม รูปแบบนี้จะอยู่ในขอบเขตตามนี้: ขอบเขตด้านล่าง 1.3523 – 1.3523
ขอบเตระยะเวลาใน M5 และ M15 อาจจะมีตำแหน่งการเข้าใช้งานที่ผิดพลาดมากยิ่งขึ้น
Open chart in a new window
รูปแบบกราฟจุดสองยอดขาลง (Double Bottom)
was formed on 25.05 at 23:50:54 (UTC+0)
signal strength 2 of 5
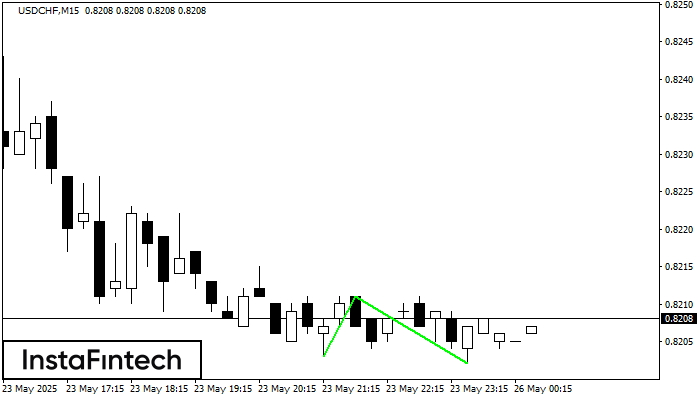
รูปแบบ รูปแบบกราฟจุดสองยอดขาลง (Double Bottom) ถูกสร้างขึ้นมาใน USDCHF M15; ขอบเขตด้านบนอยู่ที่ 0.8211;ขอบเขตด้านล่าง คือ 0.8202 ความกว้างของรูปแบบนี้คือ 8 จุด กรณีที่มีการเคลื่อนตัวทะลุผ่านขอบเขตด้านบน
ขอบเตระยะเวลาใน M5 และ M15 อาจจะมีตำแหน่งการเข้าใช้งานที่ผิดพลาดมากยิ่งขึ้น
Open chart in a new window


