

Corak sebenar

Bullish Rectangle
was formed on 09.04 at 02:09:41 (UTC+0)
signal strength 3 of 5
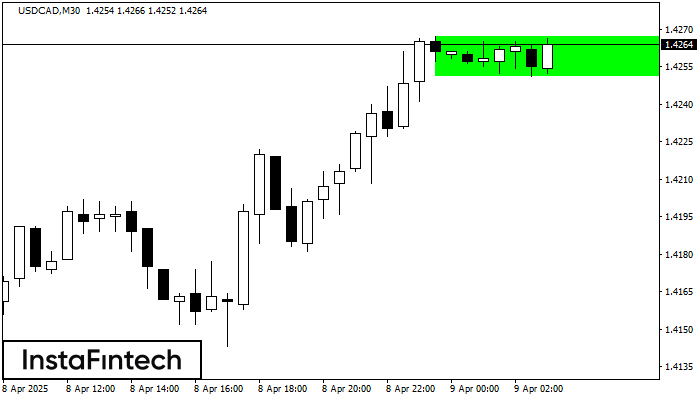
According to the chart of M30, USDCAD formed the Bullish Rectangle. The pattern indicates a trend continuation. The upper border is 1.4267, the lower border is 1.4251. The signal means that a long position should be opened above the upper border 1.4267 of the Bullish Rectangle.
- All
- All
- Bearish Rectangle
- Bearish Symmetrical Triangle
- Bearish Symmetrical Triangle
- Bullish Rectangle
- Double Top
- Double Top
- Triple Bottom
- Triple Bottom
- Triple Top
- Triple Top
- All
- All
- Buy
- Sale
- All
- 1
- 2
- 3
- 4
- 5
Head and Shoulders
was formed on 21.05 at 03:00:10 (UTC+0)
signal strength 3 of 5
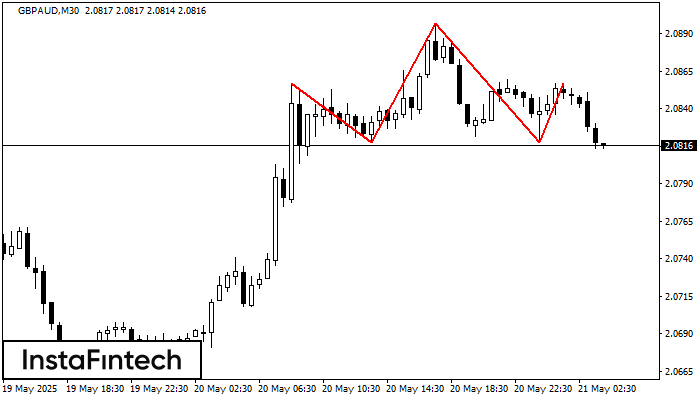
The GBPAUD M30 formed the Head and Shoulders pattern with the following features: The Head’s top is at 2.0897, the Neckline and the upward angle are at 2.0818/2.0818. The formation
Open chart in a new window
Inverse Head and Shoulder
was formed on 16.05 at 15:30:27 (UTC+0)
signal strength 3 of 5
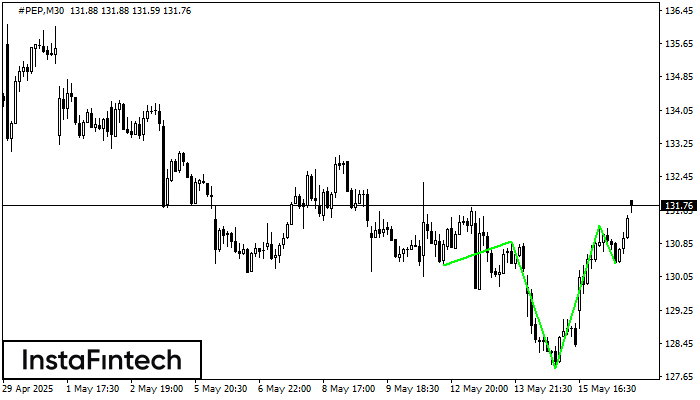
According to M30, #PEP is shaping the technical pattern – the Inverse Head and Shoulder. In case the Neckline 130.89/131.28 is broken out, the instrument is likely to move toward
Open chart in a new window
Inverse Head and Shoulder
was formed on 16.05 at 15:30:18 (UTC+0)
signal strength 3 of 5

According to the chart of M30, #PEP produced the pattern termed the Inverse Head and Shoulder. The Head is fixed at 127.86 while the median line of the Neck
Open chart in a new window

