

Corak sebenar

Bearish Rectangle
was formed on 09.04 at 01:24:35 (UTC+0)
signal strength 2 of 5
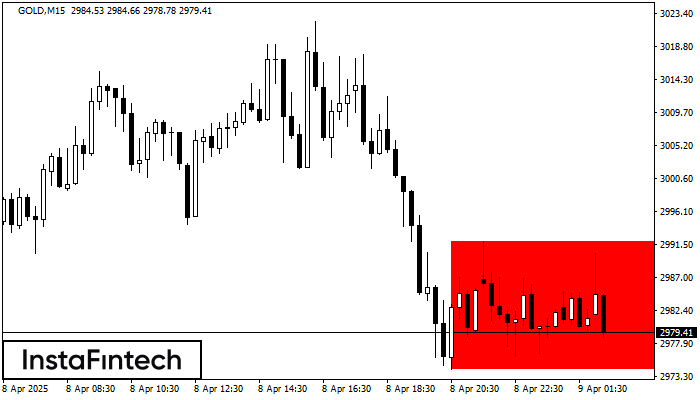
According to the chart of M15, GOLD formed the Bearish Rectangle. This type of a pattern indicates a trend continuation. It consists of two levels: resistance 2991.89 - 0.00 and support 2974.26 – 2974.26. In case the resistance level 2974.26 - 2974.26 is broken, the instrument is likely to follow the bearish trend.
The M5 and M15 time frames may have more false entry points.
Juga lihat
- All
- All
- Bearish Rectangle
- Bearish Symmetrical Triangle
- Bearish Symmetrical Triangle
- Bullish Rectangle
- Double Top
- Double Top
- Triple Bottom
- Triple Bottom
- Triple Top
- Triple Top
- All
- All
- Buy
- Sale
- All
- 1
- 2
- 3
- 4
- 5
Double Bottom
was formed on 26.05 at 03:00:31 (UTC+0)
signal strength 4 of 5
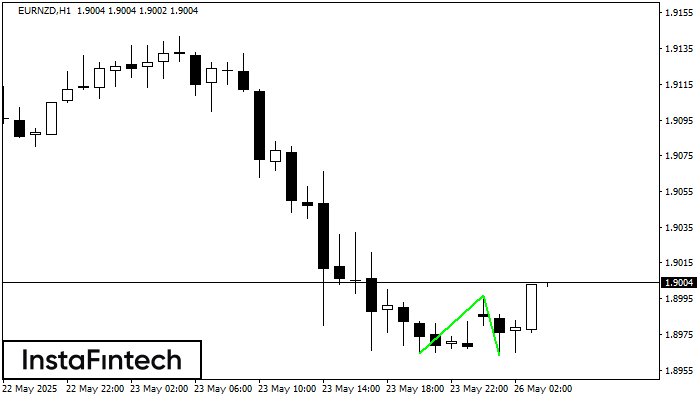
The Double Bottom pattern has been formed on EURNZD H1. This formation signals a reversal of the trend from downwards to upwards. The signal is that a buy trade should
Open chart in a new window
Double Top
was formed on 26.05 at 03:00:31 (UTC+0)
signal strength 1 of 5
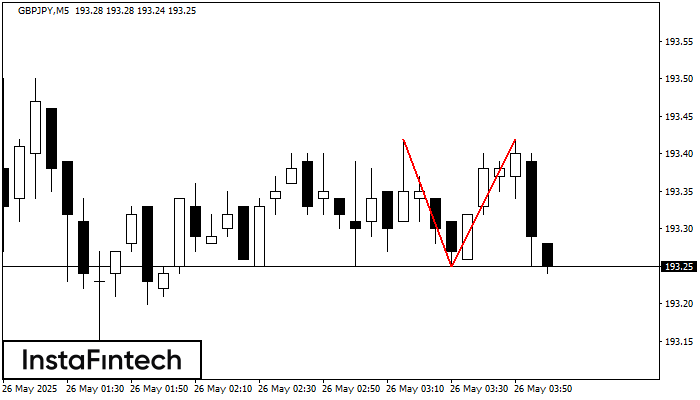
On the chart of GBPJPY M5 the Double Top reversal pattern has been formed. Characteristics: the upper boundary 193.42; the lower boundary 193.25; the width of the pattern 17 points
The M5 and M15 time frames may have more false entry points.
Open chart in a new window
Head and Shoulders
was formed on 26.05 at 02:56:04 (UTC+0)
signal strength 1 of 5
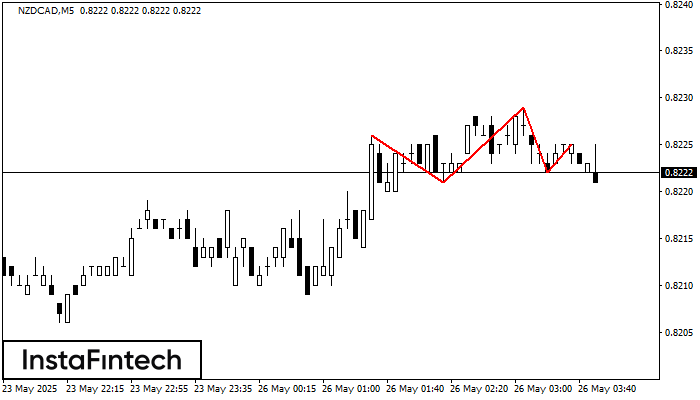
The NZDCAD M5 formed the Head and Shoulders pattern with the following features: The Head’s top is at 0.8229, the Neckline and the upward angle are at 0.8221/0.8222. The formation
The M5 and M15 time frames may have more false entry points.
Open chart in a new window


