

Corak sebenar

Double Bottom
was formed on 08.04 at 23:00:01 (UTC+0)
signal strength 1 of 5
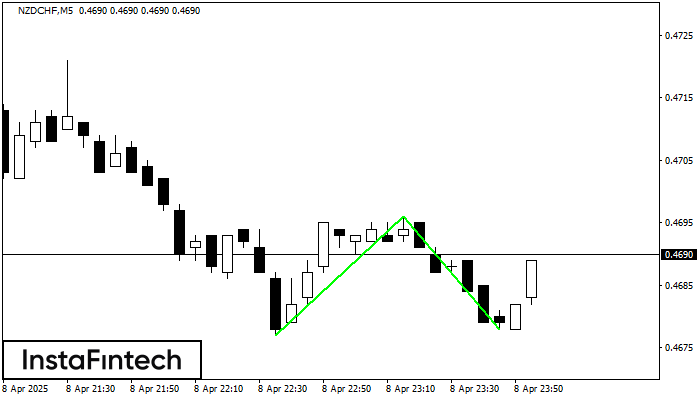
The Double Bottom pattern has been formed on NZDCHF M5; the upper boundary is 0.4696; the lower boundary is 0.4678. The width of the pattern is 19 points. In case of a break of the upper boundary 0.4696, a change in the trend can be predicted where the width of the pattern will coincide with the distance to a possible take profit level.
The M5 and M15 time frames may have more false entry points.
- All
- All
- Bearish Rectangle
- Bearish Symmetrical Triangle
- Bearish Symmetrical Triangle
- Bullish Rectangle
- Double Top
- Double Top
- Triple Bottom
- Triple Bottom
- Triple Top
- Triple Top
- All
- All
- Buy
- Sale
- All
- 1
- 2
- 3
- 4
- 5
बियरिश सिमेट्रिकल त्रिभुज
was formed on 23.05 at 04:35:13 (UTC+0)
signal strength 3 of 5
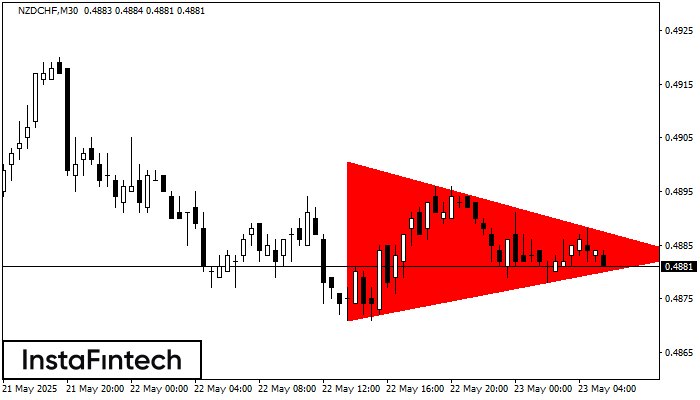
M30 के चार्ट के अनुसार, NZDCHF से बियरिश सिमेट्रिकल त्रिभुज पैटर्न बना। ट्रेडिंग अनुशंसाएं: संभावना है की निचली सीमा 0.4871 का उल्लंघन नीचे की प्रवृत्ति को जारी रखने के लिए
Open chart in a new window
बियरिश सिमेट्रिकल त्रिभुज
was formed on 23.05 at 04:34:52 (UTC+0)
signal strength 3 of 5
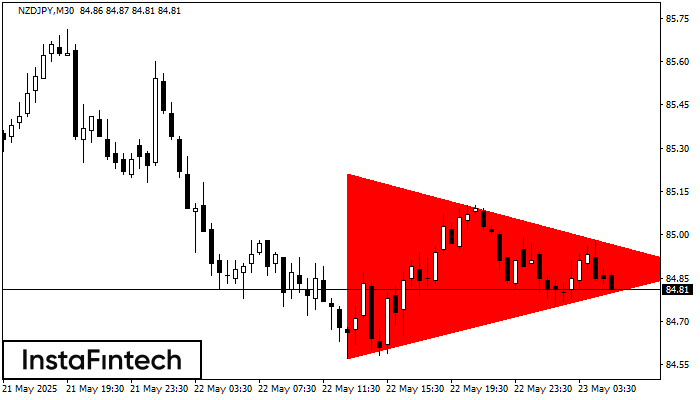
M30 के चार्ट के अनुसार, NZDJPY से बियरिश सिमेट्रिकल त्रिभुज पैटर्न बना। ट्रेडिंग अनुशंसाएं: संभावना है की निचली सीमा 84.57 का उल्लंघन नीचे की प्रवृत्ति को जारी रखने के लिए
Open chart in a new window
डबल टॉप
was formed on 23.05 at 04:30:09 (UTC+0)
signal strength 2 of 5
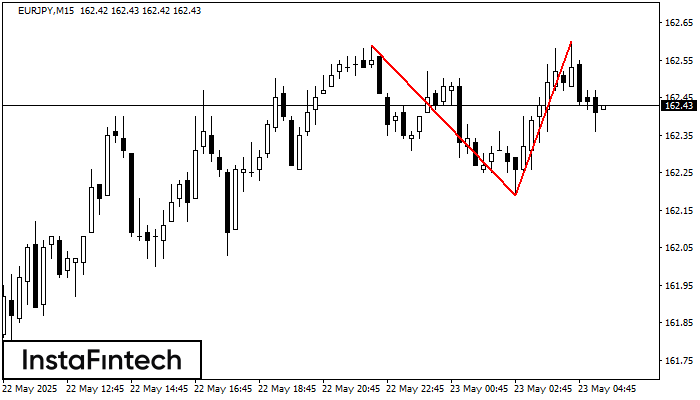
EURJPY M15 पर डबल टॉप रीवर्सल पैटर्न बना है। विशेषताएं: ऊपरी सीमा 162.59; निचली सीमा 162.19; पैटर्न की चौड़ाई 41 पॉइंट्स है। सेल ट्रेडों को 162.19 की निचली सीमा के
M5 और M15 समय सीमा में अधिक फाल्स एंट्री पॉइंट्स हो सकते हैं।
Open chart in a new window


