

Corak sebenar

Double Bottom
was formed on 08.04 at 20:35:33 (UTC+0)
signal strength 1 of 5
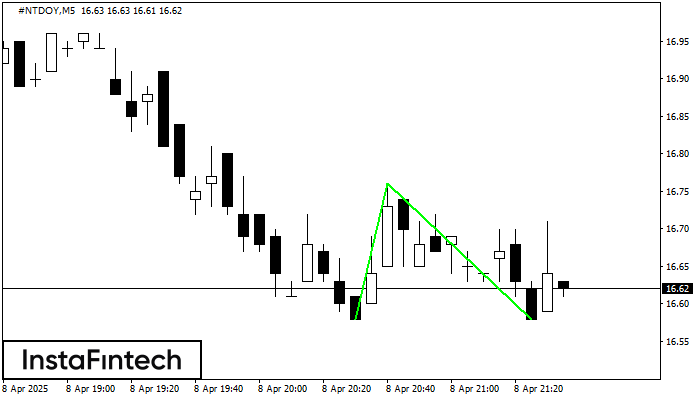
The Double Bottom pattern has been formed on #NTDOY M5. This formation signals a reversal of the trend from downwards to upwards. The signal is that a buy trade should be opened after the upper boundary of the pattern 16.76 is broken. The further movements will rely on the width of the current pattern 18 points.
The M5 and M15 time frames may have more false entry points.
- All
- All
- Bearish Rectangle
- Bearish Symmetrical Triangle
- Bearish Symmetrical Triangle
- Bullish Rectangle
- Double Top
- Double Top
- Triple Bottom
- Triple Bottom
- Triple Top
- Triple Top
- All
- All
- Buy
- Sale
- All
- 1
- 2
- 3
- 4
- 5
Bearish Rectangle
was formed on 28.05 at 15:05:49 (UTC+0)
signal strength 1 of 5
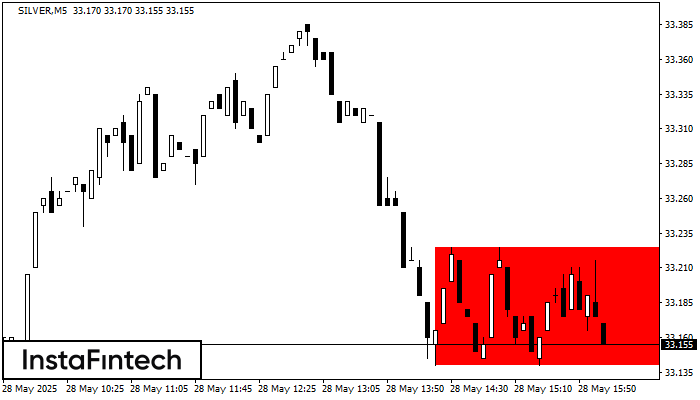
According to the chart of M5, SILVER formed the Bearish Rectangle. The pattern indicates a trend continuation. The upper border is 33.23, the lower border is 33.14. The signal means
The M5 and M15 time frames may have more false entry points.
Open chart in a new window
Bullish Symmetrical Triangle
was formed on 28.05 at 14:59:02 (UTC+0)
signal strength 2 of 5
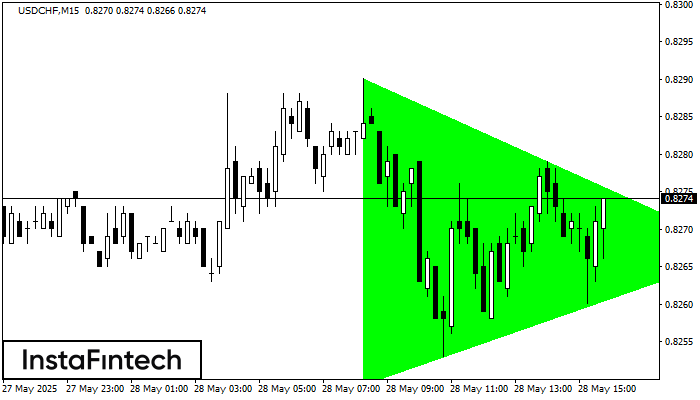
According to the chart of M15, USDCHF formed the Bullish Symmetrical Triangle pattern, which signals the trend will continue. Description. The upper border of the pattern touches the coordinates 0.8290/0.8267
The M5 and M15 time frames may have more false entry points.
Open chart in a new window
Double Bottom
was formed on 28.05 at 14:36:46 (UTC+0)
signal strength 1 of 5
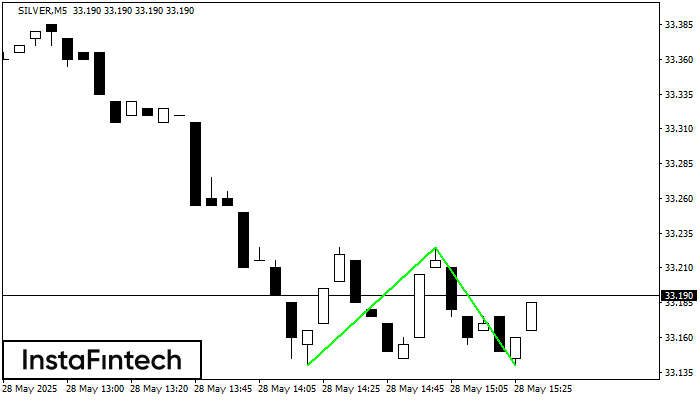
The Double Bottom pattern has been formed on SILVER M5. Characteristics: the support level 33.14; the resistance level 33.23; the width of the pattern 85 points. If the resistance level
The M5 and M15 time frames may have more false entry points.
Open chart in a new window


