

Corak sebenar

Double Bottom
was formed on 08.04 at 20:35:12 (UTC+0)
signal strength 1 of 5
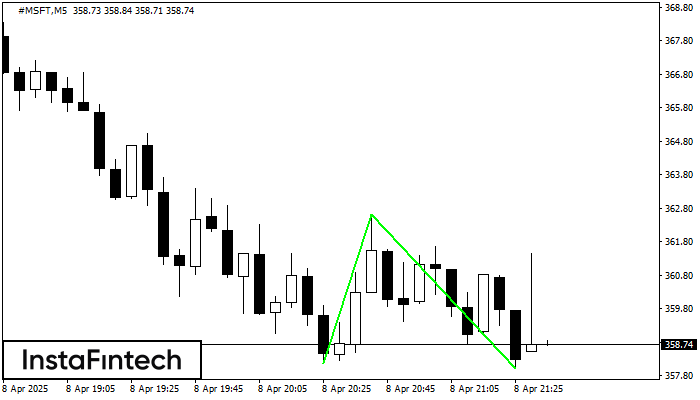
The Double Bottom pattern has been formed on #MSFT M5; the upper boundary is 362.62; the lower boundary is 358.00. The width of the pattern is 446 points. In case of a break of the upper boundary 362.62, a change in the trend can be predicted where the width of the pattern will coincide with the distance to a possible take profit level.
The M5 and M15 time frames may have more false entry points.
- All
- All
- Bearish Rectangle
- Bearish Symmetrical Triangle
- Bearish Symmetrical Triangle
- Bullish Rectangle
- Double Top
- Double Top
- Triple Bottom
- Triple Bottom
- Triple Top
- Triple Top
- All
- All
- Buy
- Sale
- All
- 1
- 2
- 3
- 4
- 5
Segi Tiga Simetri Menaik
was formed on 24.05 at 18:46:25 (UTC+0)
signal strength 2 of 5

Berdasarkan carta M15, #Bitcoin membentuk corak Segi Tiga Simetri Menaik yang menandakan aliran akan berterusan. Penerangan. Sempadan atas corak menyentuh koordinat 109440.14/108872.57 sedangkan sempadan bawah merentasi 108311.13/108872.57. Lebar corak diukur
Carta masa M5 dan M15 mungkin mempunyai lebih banyak titik kemasukan palsu.
Open chart in a new window
Segi Empat Menurun
was formed on 23.05 at 23:00:20 (UTC+0)
signal strength 1 of 5

Berdasarkan carta M5, EURNZD telah membentuk Segi Empat Menurun. Corak ini menunjukkan kesinambungan aliran. Sempadan atas adalah 1.8982, sempadan bawah adalah 1.8964. Isyarat bermakna bahawa kedudukan pendek perlu dibuka selepas
Carta masa M5 dan M15 mungkin mempunyai lebih banyak titik kemasukan palsu.
Open chart in a new window
Segi Tiga Simetri Menaik
was formed on 23.05 at 22:14:53 (UTC+0)
signal strength 1 of 5

Berdasarkan carta M5, AUDCHF membentuk corak Segi Tiga Simetri Menaik. Penerangan: Ini adalah corak kesinambungan aliran. 0.5335 dan 0.5329 adalah koordinat sempadan atas dan bawah masing-masing. Lebar corak diukur pada
Carta masa M5 dan M15 mungkin mempunyai lebih banyak titik kemasukan palsu.
Open chart in a new window


