

Corak sebenar

Bearish Flag
was formed on 08.04 at 18:17:39 (UTC+0)
signal strength 1 of 5

The Bearish Flag pattern has been formed on the chart GOLD M5. Therefore, the downwards trend is likely to continue in the nearest term. As soon as the price breaks below the low at 2993.55, traders should enter the market.
The M5 and M15 time frames may have more false entry points.
Juga lihat
- All
- All
- Bearish Rectangle
- Bearish Symmetrical Triangle
- Bearish Symmetrical Triangle
- Bullish Rectangle
- Double Top
- Double Top
- Triple Bottom
- Triple Bottom
- Triple Top
- Triple Top
- All
- All
- Buy
- Sale
- All
- 1
- 2
- 3
- 4
- 5
Bearish Symmetrical Triangle
was formed on 05.08 at 12:50:05 (UTC+0)
signal strength 1 of 5
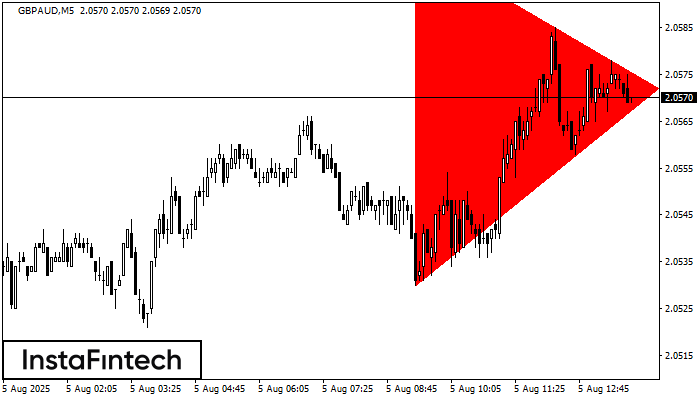
According to the chart of M5, GBPAUD formed the Bearish Symmetrical Triangle pattern. This pattern signals a further downward trend in case the lower border 2.0530 is breached. Here
The M5 and M15 time frames may have more false entry points.
Open chart in a new window
Double Top
was formed on 05.08 at 12:14:53 (UTC+0)
signal strength 1 of 5
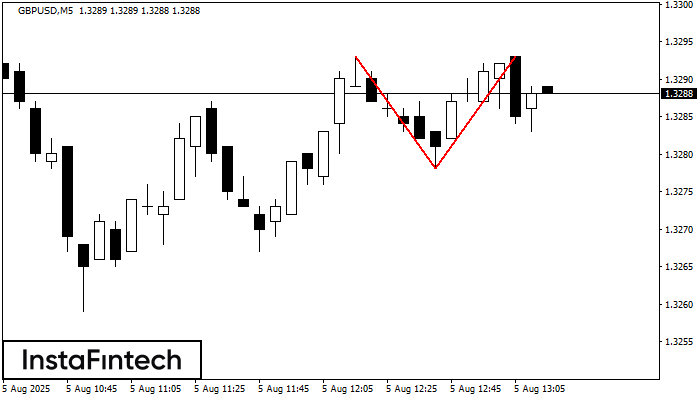
The Double Top reversal pattern has been formed on GBPUSD M5. Characteristics: the upper boundary 1.3293; the lower boundary 1.3278; the width of the pattern is 15 points. Sell trades
The M5 and M15 time frames may have more false entry points.
Open chart in a new window
Double Bottom
was formed on 05.08 at 10:00:07 (UTC+0)
signal strength 4 of 5
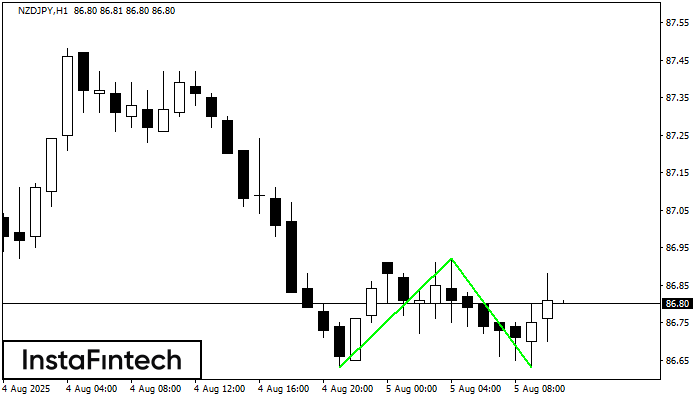
The Double Bottom pattern has been formed on NZDJPY H1. This formation signals a reversal of the trend from downwards to upwards. The signal is that a buy trade should
Open chart in a new window


