

Corak sebenar

Bearish pennant
was formed on 08.04 at 18:17:34 (UTC+0)
signal strength 1 of 5
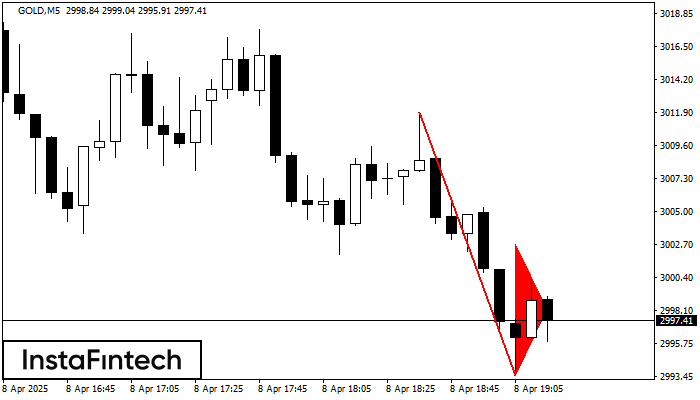
The Bearish pennant pattern has formed on the GOLD M5 chart. This pattern type is characterized by a slight slowdown after which the price will move in the direction of the original trend. In case the price fixes below the pattern’s low of 2993.55, a trader will be able to successfully enter the sell position.
The M5 and M15 time frames may have more false entry points.
- All
- All
- Bearish Rectangle
- Bearish Symmetrical Triangle
- Bearish Symmetrical Triangle
- Bullish Rectangle
- Double Top
- Double Top
- Triple Bottom
- Triple Bottom
- Triple Top
- Triple Top
- All
- All
- Buy
- Sale
- All
- 1
- 2
- 3
- 4
- 5
Segi Empat Menaik
was formed on 28.05 at 03:30:25 (UTC+0)
signal strength 2 of 5
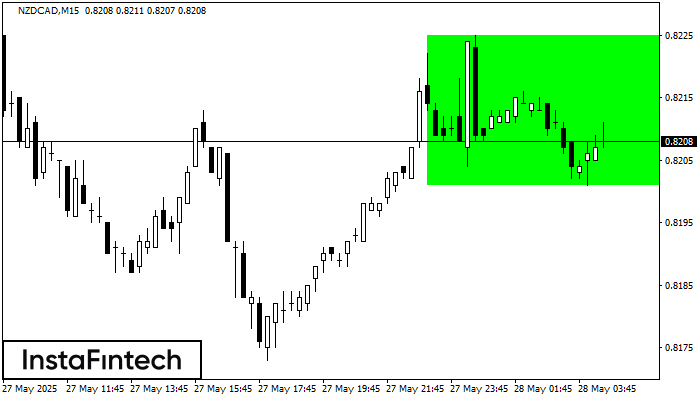
Berdasarkan carta M15, NZDCAD telah membentuk Segi Empat Menaik. Jenis corak ini menunjukkan kesinambungan aliran. Ia terdiri daripada dua tahap: rintangan 0.8225 dan sokongan 0.8201. Sekiranya tahap rintangan 0.8225
Carta masa M5 dan M15 mungkin mempunyai lebih banyak titik kemasukan palsu.
Open chart in a new window
Triple Top
was formed on 28.05 at 03:01:28 (UTC+0)
signal strength 3 of 5
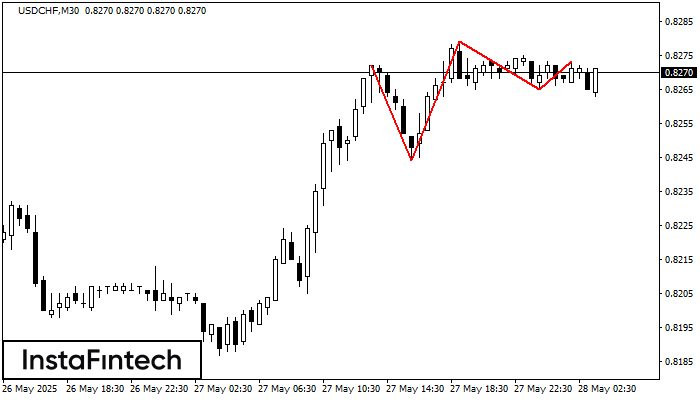
Corak Triple Top telah dibentuk pada carta bagi instrumen dagangan USDCHF M30. Ia adalah corak pembalikan yang memaparkan ciri-ciri berikut: tahap rintangan -1, tahap sokongan -21, dan lebar corak
Open chart in a new window
Triple Bottom
was formed on 28.05 at 03:00:31 (UTC+0)
signal strength 2 of 5
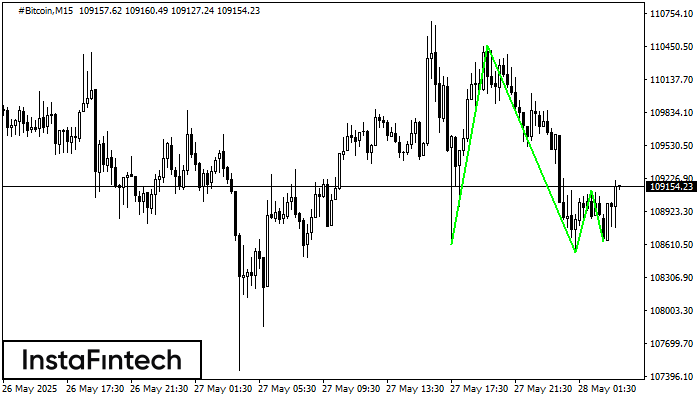
Corak Triple Bottom telah dibentuk pada carta #Bitcoin M15. Ciri-ciri corak: Garisan bawah corak mempunyai koordinat 110459.83 dengan had atas 110459.83/109114.84, unjuran lebar adalah 184898 mata. Pembentukan corak Triple Bottom
Carta masa M5 dan M15 mungkin mempunyai lebih banyak titik kemasukan palsu.
Open chart in a new window

