

Corak sebenar

Double Top
was formed on 08.04 at 17:30:23 (UTC+0)
signal strength 2 of 5
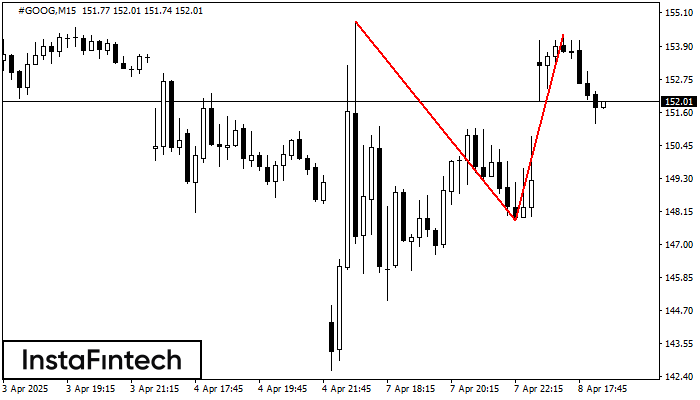
The Double Top pattern has been formed on #GOOG M15. It signals that the trend has been changed from upwards to downwards. Probably, if the base of the pattern 147.83 is broken, the downward movement will continue.
The M5 and M15 time frames may have more false entry points.
- All
- All
- Bearish Rectangle
- Bearish Symmetrical Triangle
- Bearish Symmetrical Triangle
- Bullish Rectangle
- Double Top
- Double Top
- Triple Bottom
- Triple Bottom
- Triple Top
- Triple Top
- All
- All
- Buy
- Sale
- All
- 1
- 2
- 3
- 4
- 5
Bearish Symmetrical Triangle
was formed on 29.05 at 22:19:03 (UTC+0)
signal strength 1 of 5
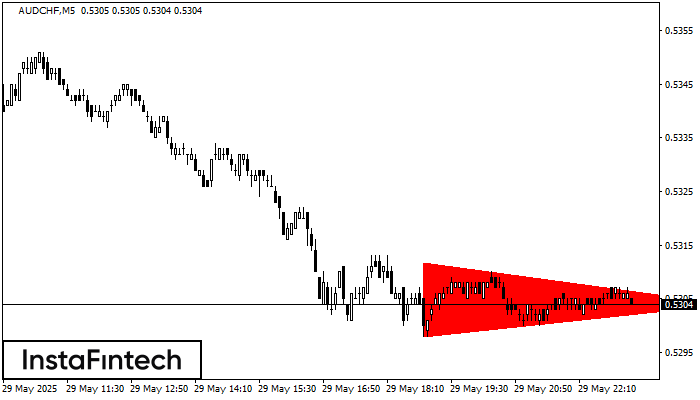
According to the chart of M5, AUDCHF formed the Bearish Symmetrical Triangle pattern. Trading recommendations: A breach of the lower border 0.5298 is likely to encourage a continuation
The M5 and M15 time frames may have more false entry points.
Open chart in a new window
Bullish Flag
was formed on 29.05 at 22:16:27 (UTC+0)
signal strength 3 of 5
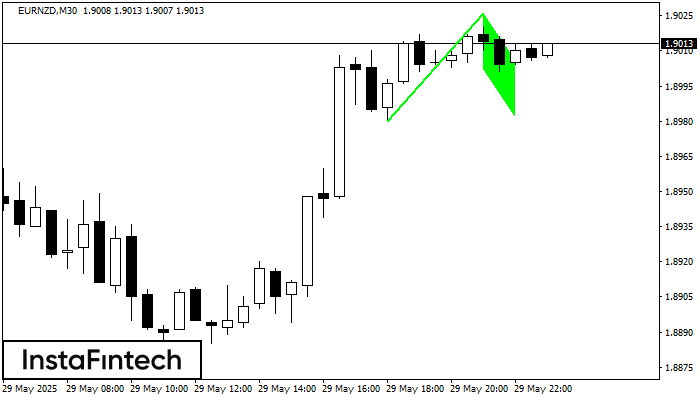
The Bullish Flag pattern which signals continuation of a trend has been formed on the chart EURNZD M30. Forecast: if the price breaks above the pattern high at 1.9026, then
Open chart in a new window
Bullish pennant
was formed on 29.05 at 22:16:23 (UTC+0)
signal strength 3 of 5
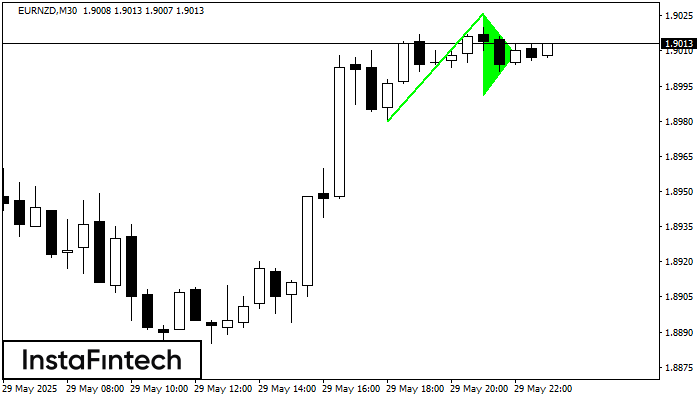
The Bullish pennant graphic pattern has formed on the EURNZD M30 instrument. This pattern type falls under the category of continuation patterns. In this case, if the quote can breaks
Open chart in a new window


