

Corak sebenar

Bullish Symmetrical Triangle
was formed on 08.04 at 14:47:55 (UTC+0)
signal strength 3 of 5
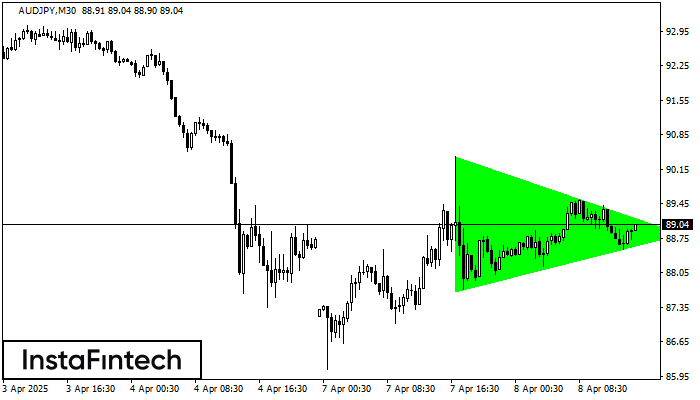
According to the chart of M30, AUDJPY formed the Bullish Symmetrical Triangle pattern. Description: This is the pattern of a trend continuation. 90.41 and 87.68 are the coordinates of the upper and lower borders respectively. The pattern width is measured on the chart at 273 pips. Outlook: If the upper border 90.41 is broken, the price is likely to continue its move by 89.12.
- All
- All
- Bearish Rectangle
- Bearish Symmetrical Triangle
- Bearish Symmetrical Triangle
- Bullish Rectangle
- Double Top
- Double Top
- Triple Bottom
- Triple Bottom
- Triple Top
- Triple Top
- All
- All
- Buy
- Sale
- All
- 1
- 2
- 3
- 4
- 5
Bullish Rectangle
was formed on 28.05 at 03:30:25 (UTC+0)
signal strength 2 of 5
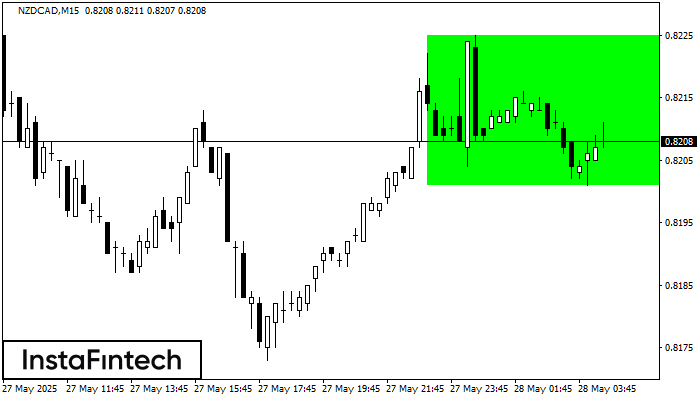
According to the chart of M15, NZDCAD formed the Bullish Rectangle. This type of a pattern indicates a trend continuation. It consists of two levels: resistance 0.8225 and support 0.8201
The M5 and M15 time frames may have more false entry points.
Open chart in a new window
Triple Top
was formed on 28.05 at 03:01:28 (UTC+0)
signal strength 3 of 5
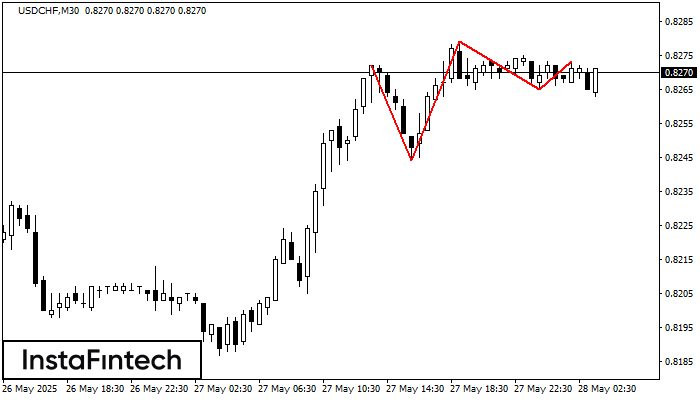
The Triple Top pattern has formed on the chart of the USDCHF M30 trading instrument. It is a reversal pattern featuring the following characteristics: resistance level -1, support level -21
Open chart in a new window
Triple Bottom
was formed on 28.05 at 03:00:31 (UTC+0)
signal strength 2 of 5
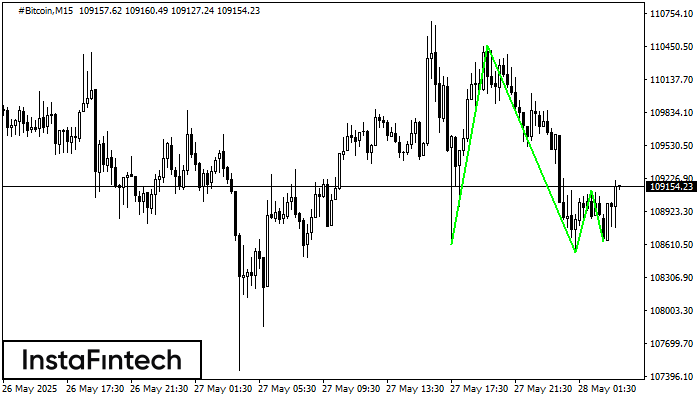
The Triple Bottom pattern has formed on the chart of #Bitcoin M15. Features of the pattern: The lower line of the pattern has coordinates 110459.83 with the upper limit 110459.83/109114.84
The M5 and M15 time frames may have more false entry points.
Open chart in a new window


