

Corak sebenar

Bearish pennant
was formed on 08.04 at 12:50:05 (UTC+0)
signal strength 2 of 5
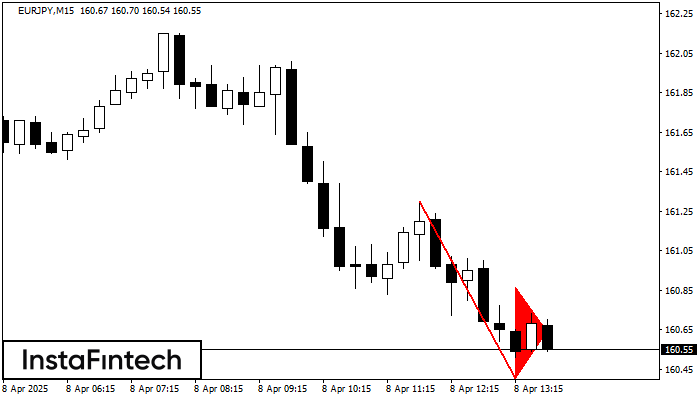
The Bearish pennant pattern has formed on the EURJPY M15 chart. It signals potential continuation of the existing trend. Specifications: the pattern’s bottom has the coordinate of 160.40; the projection of the flagpole height is equal to 90 pips. In case the price breaks out the pattern’s bottom of 160.40, the downtrend is expected to continue for further level 160.18.
The M5 and M15 time frames may have more false entry points.
Juga lihat
- All
- All
- Bearish Rectangle
- Bearish Symmetrical Triangle
- Bearish Symmetrical Triangle
- Bullish Rectangle
- Double Top
- Double Top
- Triple Bottom
- Triple Bottom
- Triple Top
- Triple Top
- All
- All
- Buy
- Sale
- All
- 1
- 2
- 3
- 4
- 5
Double Bottom
was formed on 30.05 at 20:46:52 (UTC+0)
signal strength 2 of 5
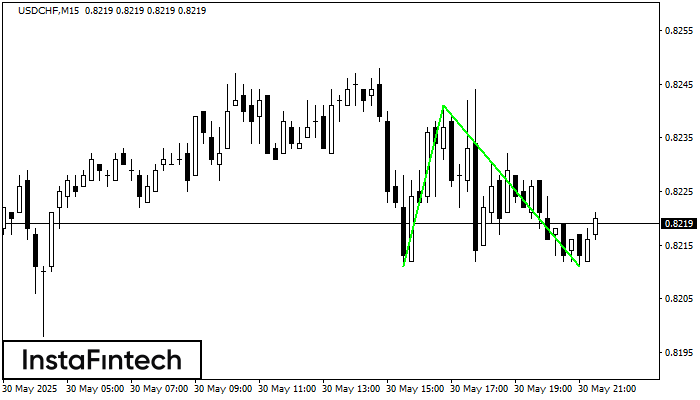
Corak Double Bottom telah dibentuk pada USDCHF M15. Ciri-ciri: tahap sokongan 0.8211; tahap rintangan 0.8241; lebar corak 30 mata. Sekiranya tahap rintangan ditembusi, perubahan aliran boleh diramalkan dengan titik sasaran
Carta masa M5 dan M15 mungkin mempunyai lebih banyak titik kemasukan palsu.
Open chart in a new window
Triple Bottom
was formed on 30.05 at 20:25:24 (UTC+0)
signal strength 1 of 5
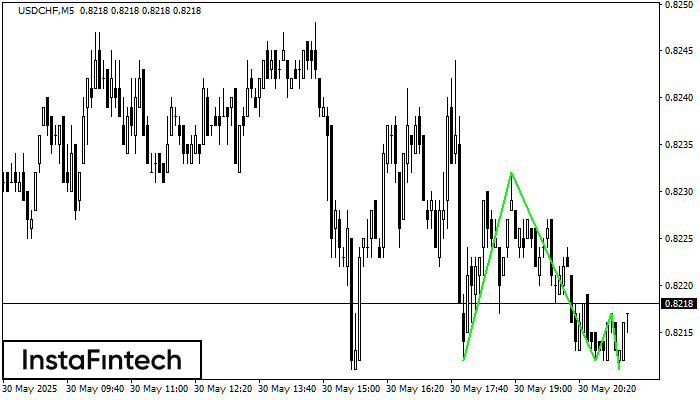
Corak Triple Bottom telah dibentuk pada carta bagi instrumen dagangan USDCHF M5. Corak menandakan perubahan aliran dari menurun ke aliran menaik dalam sekiranya penembusan 0.8232/0.8217
Carta masa M5 dan M15 mungkin mempunyai lebih banyak titik kemasukan palsu.
Open chart in a new window
Double Bottom
was formed on 30.05 at 20:10:20 (UTC+0)
signal strength 1 of 5
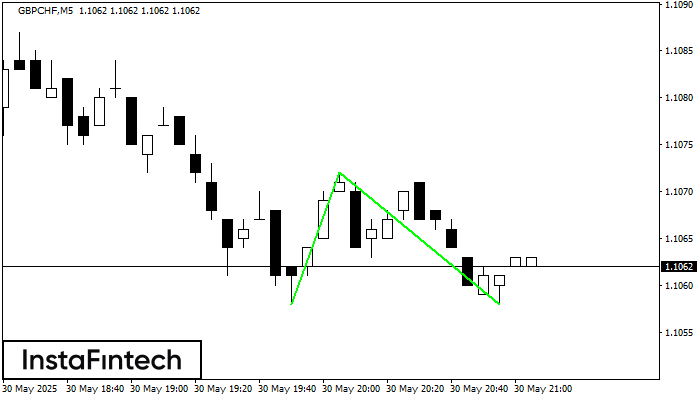
Corak Double Bottom telah dibentuk pada GBPCHF M5. Pembentukan ini menandakan pembalikan aliran dari aliran menurun ke atas. Isyarat ialah perdagangan membeli harus dibuka selepas sempadan atas corak 1.1072 telah
Carta masa M5 dan M15 mungkin mempunyai lebih banyak titik kemasukan palsu.
Open chart in a new window


