

Corak sebenar

Bearish Symmetrical Triangle
was formed on 08.04 at 12:30:45 (UTC+0)
signal strength 4 of 5
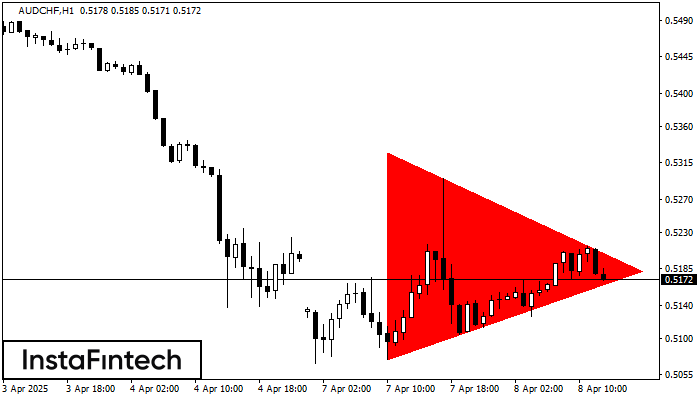
According to the chart of H1, AUDCHF formed the Bearish Symmetrical Triangle pattern. Description: The lower border is 0.5074/0.5182 and upper border is 0.5328/0.5182. The pattern width is measured on the chart at -254 pips. The formation of the Bearish Symmetrical Triangle pattern evidently signals a continuation of the downward trend. In other words, if the scenario comes true and AUDCHF breaches the lower border, the price could continue its move toward 0.5142.
Juga lihat
- All
- All
- Bearish Rectangle
- Bearish Symmetrical Triangle
- Bearish Symmetrical Triangle
- Bullish Rectangle
- Double Top
- Double Top
- Triple Bottom
- Triple Bottom
- Triple Top
- Triple Top
- All
- All
- Buy
- Sale
- All
- 1
- 2
- 3
- 4
- 5
Double Bottom
was formed on 29.05 at 05:19:51 (UTC+0)
signal strength 1 of 5
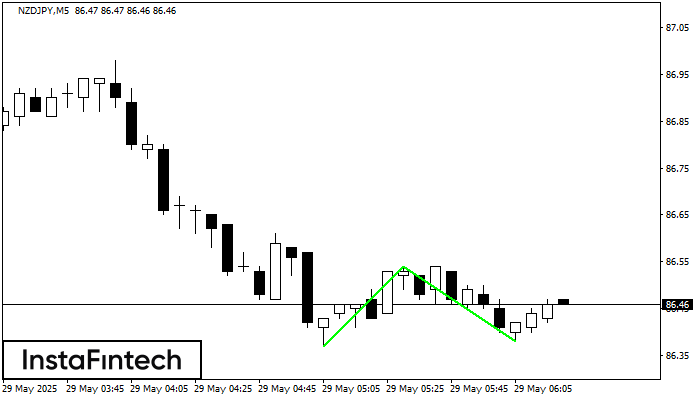
Corak Double Bottom telah dibentuk pada NZDJPY M5. Ciri-ciri: tahap sokongan 86.37; tahap rintangan 86.54; lebar corak 17 mata. Sekiranya tahap rintangan ditembusi, perubahan aliran boleh diramalkan dengan titik sasaran
Carta masa M5 dan M15 mungkin mempunyai lebih banyak titik kemasukan palsu.
Open chart in a new window
Double Top
was formed on 29.05 at 03:41:06 (UTC+0)
signal strength 1 of 5
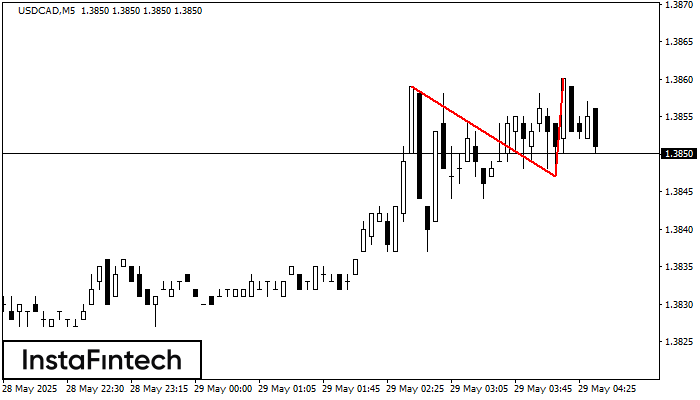
Corak pembalikan Double Top telah dibentuk pada USDCAD M5. Ciri-ciri: sempadan atas %P0.000000; sempadan bawah 1.3859; sempadan bawah 1.3847; lebar corak adalah 13 mata. Dagangan menjual adalah lebih baik untuk
Carta masa M5 dan M15 mungkin mempunyai lebih banyak titik kemasukan palsu.
Open chart in a new window
Double Top
was formed on 29.05 at 03:20:04 (UTC+0)
signal strength 1 of 5
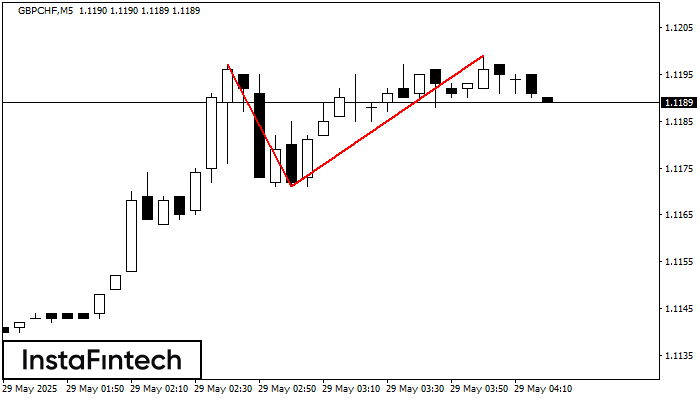
Corak Double Top telah dibentuk pada GBPCHF M5. Isyarat bahawa aliran telah berubah dari aliran menaik ke aliran menurun. Mungkin, sekiranya asas corak 1.1171 ditembusi, pergerakan menurun akan berterusan
Carta masa M5 dan M15 mungkin mempunyai lebih banyak titik kemasukan palsu.
Open chart in a new window


