

Corak sebenar

Bullish Rectangle
was formed on 08.04 at 08:41:05 (UTC+0)
signal strength 1 of 5
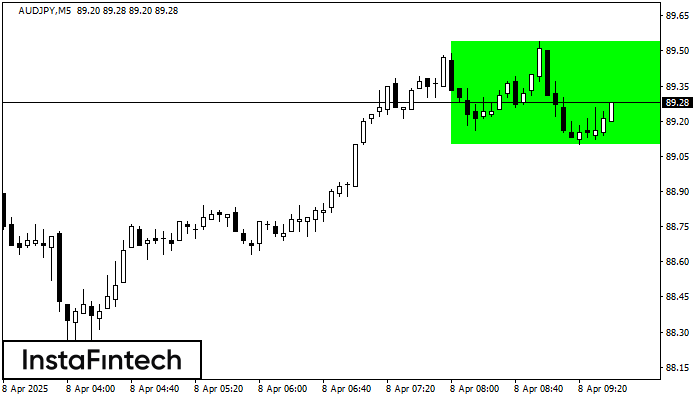
According to the chart of M5, AUDJPY formed the Bullish Rectangle. This type of a pattern indicates a trend continuation. It consists of two levels: resistance 89.54 and support 89.10. In case the resistance level 89.54 - 89.54 is broken, the instrument is likely to follow the bullish trend.
The M5 and M15 time frames may have more false entry points.
- All
- All
- Bearish Rectangle
- Bearish Symmetrical Triangle
- Bearish Symmetrical Triangle
- Bullish Rectangle
- Double Top
- Double Top
- Triple Bottom
- Triple Bottom
- Triple Top
- Triple Top
- All
- All
- Buy
- Sale
- All
- 1
- 2
- 3
- 4
- 5
Segi Empat Menurun
was formed on 01.08 at 22:59:03 (UTC+0)
signal strength 1 of 5
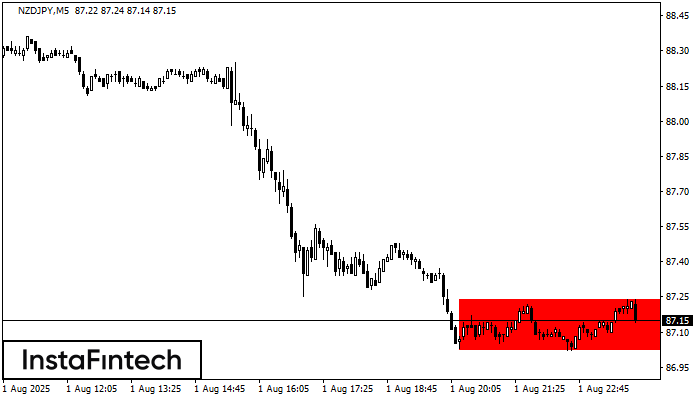
Berdasarkan carta M5, NZDJPY telah membentuk Segi Empat Menurun. Corak ini menunjukkan kesinambungan aliran. Sempadan atas adalah 87.24, sempadan bawah adalah 87.02. Isyarat bermakna bahawa kedudukan pendek perlu dibuka selepas
Carta masa M5 dan M15 mungkin mempunyai lebih banyak titik kemasukan palsu.
Open chart in a new window
Double Bottom
was formed on 01.08 at 22:15:59 (UTC+0)
signal strength 2 of 5
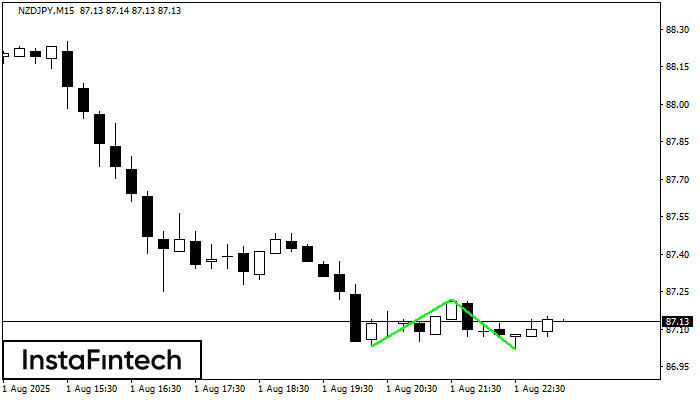
Corak Double Bottom telah dibentuk pada NZDJPY M15. Pembentukan ini menandakan pembalikan aliran dari aliran menurun ke atas. Isyarat ialah perdagangan membeli harus dibuka selepas sempadan atas corak 87.22 telah
Carta masa M5 dan M15 mungkin mempunyai lebih banyak titik kemasukan palsu.
Open chart in a new window
Inverse Head dan Shoulder
was formed on 01.08 at 21:45:31 (UTC+0)
signal strength 2 of 5
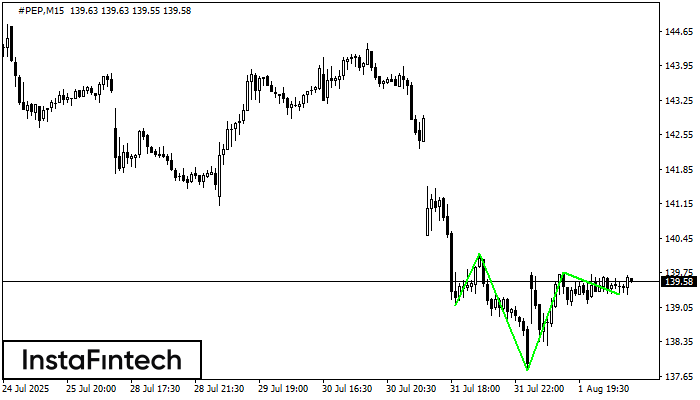
Berdasarkan carta M15, #PEP menghasilkan corak yang dinyatakan Inverse Head dan Shoulder. Head telah ditetapkan pada 137.78 manakala garisan median Neck ditetapkan pada 140.14/139.76. Pembentukan Corak Inverse Head dan Shoulder
Carta masa M5 dan M15 mungkin mempunyai lebih banyak titik kemasukan palsu.
Open chart in a new window

