

Corak sebenar

Bullish Flag
was formed on 08.04 at 06:40:26 (UTC+0)
signal strength 1 of 5
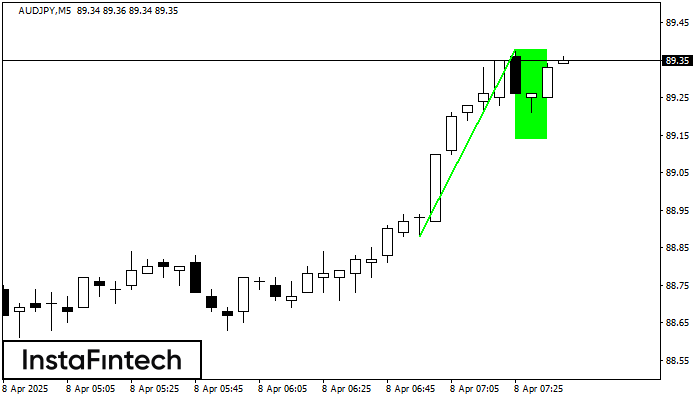
The Bullish Flag pattern has been formed on AUDJPY at M5. The lower boundary of the pattern is located at 89.14/89.14, while the higher boundary lies at 89.38/89.38. The projection of the flagpole is 50 points. This formation signals that the upward trend is most likely to continue. Therefore, if the level of 89.38 is broken, the price will move further upwards.
The M5 and M15 time frames may have more false entry points.
- All
- All
- Bearish Rectangle
- Bearish Symmetrical Triangle
- Bearish Symmetrical Triangle
- Bullish Rectangle
- Double Top
- Double Top
- Triple Bottom
- Triple Bottom
- Triple Top
- Triple Top
- All
- All
- Buy
- Sale
- All
- 1
- 2
- 3
- 4
- 5
Медвежий симметричный треугольник
сформирован 02.06 в 21:58:20 (UTC+0)
сила сигнала 1 из 5
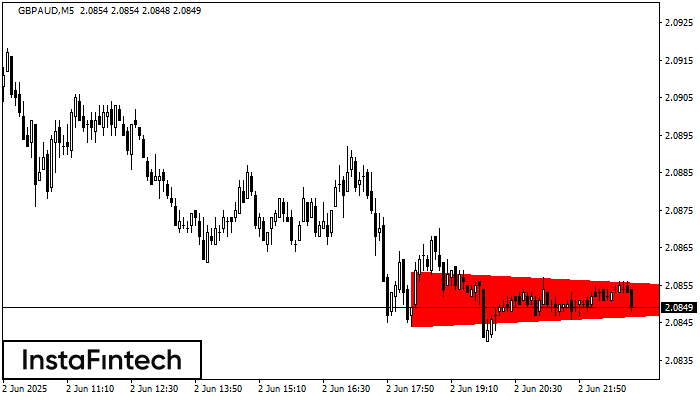
На графике GBPAUD M5 сформировалась фигура «Медвежий симметричный треугольник». Характеристика фигуры: Нижняя граница 2.0844/2.0851; Верхняя граница 2.0859/2.0851; Проекция ширины фигуры -15 пунктов. Формирование фигуры «Медвежий симметричный треугольник» наиболее вероятным образом
Таймфреймы М5 и М15 могут иметь больше ложных точек входа.
Открыть график инструмента в новом окне
Двойная вершина
сформирован 02.06 в 21:45:24 (UTC+0)
сила сигнала 1 из 5
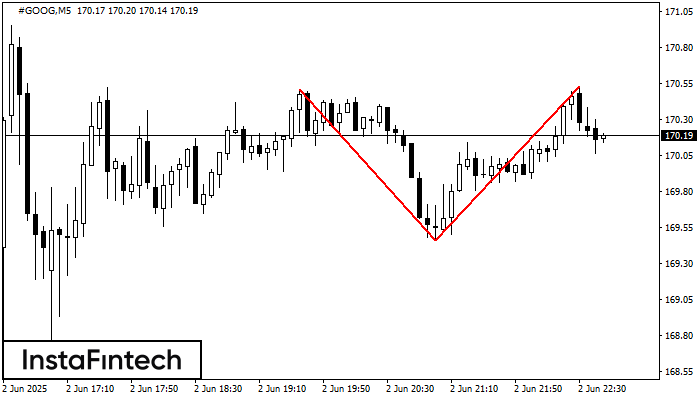
На торговом графике #GOOG M5 сформировалась разворотная фигура «Двойная вершина». Характеристика: Верхняя граница 170.53; Нижняя граница 169.46; Ширина фигуры 107 пунктов. Сигнал: Пробой нижней границы 169.46 приведет к дальнейшему нисходящему
Таймфреймы М5 и М15 могут иметь больше ложных точек входа.
Открыть график инструмента в новом окне
Прямоугольник
сформирован 02.06 в 21:36:21 (UTC+0)
сила сигнала 3 из 5
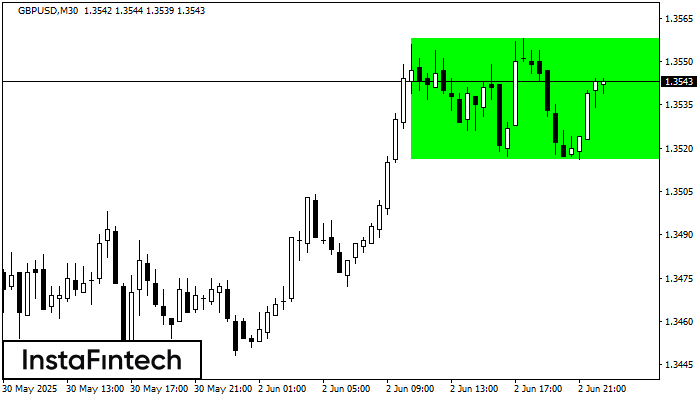
По GBPUSD на M30 сформировалась фигура «Прямоугольник». Фигура данного типа относится к тому типу продолжения тренда, который содержит в себе два уровня: Сопротивление 1.3558; Поддержка 1.3516. В случае пробоя уровня
Открыть график инструмента в новом окне

