

Corak sebenar

Double Top
was formed on 07.04 at 15:14:54 (UTC+0)
signal strength 2 of 5
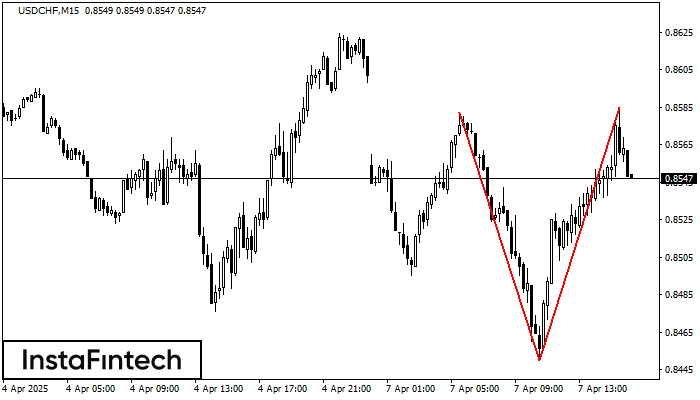
The Double Top pattern has been formed on USDCHF M15. It signals that the trend has been changed from upwards to downwards. Probably, if the base of the pattern 0.8450 is broken, the downward movement will continue.
The M5 and M15 time frames may have more false entry points.
Juga lihat
- All
- All
- Bearish Rectangle
- Bearish Symmetrical Triangle
- Bearish Symmetrical Triangle
- Bullish Rectangle
- Double Top
- Double Top
- Triple Bottom
- Triple Bottom
- Triple Top
- Triple Top
- All
- All
- Buy
- Sale
- All
- 1
- 2
- 3
- 4
- 5
Head dan Shoulders
was formed on 05.06 at 04:45:35 (UTC+0)
signal strength 1 of 5
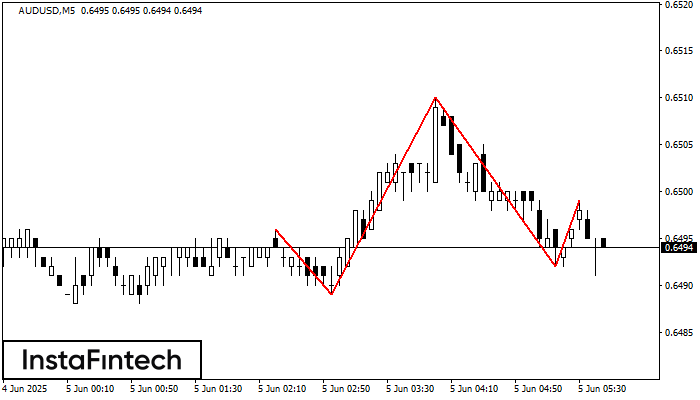
Corak teknikal yang dipanggil Head dan Shoulders telah muncul pada carta AUDUSD M5. Terdapat alasan yang berat untuk menunjukkan bahawa harga akan mengatasi garisan Neck 0.6489/0.6492 selepas Shoulder kanan telah
Carta masa M5 dan M15 mungkin mempunyai lebih banyak titik kemasukan palsu.
Open chart in a new window
Segi Empat Menurun
was formed on 05.06 at 04:06:17 (UTC+0)
signal strength 2 of 5

Berdasarkan carta M15, EURCHF telah membentuk Segi Empat Menurun. Corak ini menunjukkan kesinambungan aliran. Sempadan atas adalah 0.9348, sempadan bawah adalah 0.9337. Isyarat bermakna bahawa kedudukan pendek perlu dibuka selepas
Carta masa M5 dan M15 mungkin mempunyai lebih banyak titik kemasukan palsu.
Open chart in a new window
Double Top
was formed on 05.06 at 04:00:46 (UTC+0)
signal strength 3 of 5
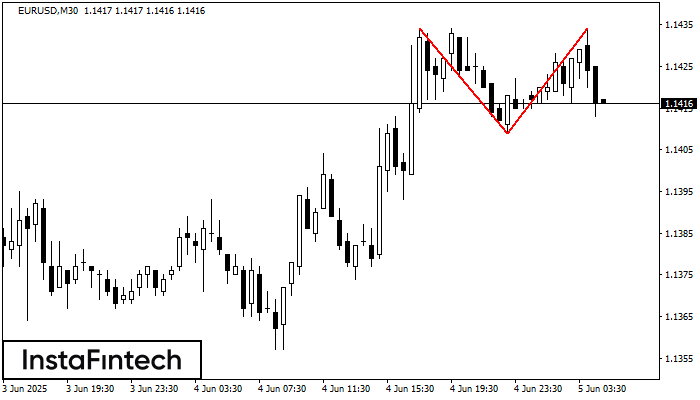
Corak Double Top telah dibentuk pada EURUSD M30. Isyarat bahawa aliran telah berubah dari aliran menaik ke aliran menurun. Mungkin, sekiranya asas corak 1.1409 ditembusi, pergerakan menurun akan berterusan
Open chart in a new window


