

Corak sebenar

Head and Shoulders
was formed on 07.04 at 10:35:00 (UTC+0)
signal strength 1 of 5

The EURCAD M5 formed the Head and Shoulders pattern with the following features: The Head’s top is at 1.5734, the Neckline and the upward angle are at 1.5652/1.5644. The formation of this pattern can bring about changes in the current trend from bullish to bearish. In case the pattern triggers the expected changes, the price of EURCAD will go towards 1.5629.
The M5 and M15 time frames may have more false entry points.
- All
- All
- Bearish Rectangle
- Bearish Symmetrical Triangle
- Bearish Symmetrical Triangle
- Bullish Rectangle
- Double Top
- Double Top
- Triple Bottom
- Triple Bottom
- Triple Top
- Triple Top
- All
- All
- Buy
- Sale
- All
- 1
- 2
- 3
- 4
- 5
Segi Empat Menaik
was formed on 02.06 at 22:15:32 (UTC+0)
signal strength 4 of 5
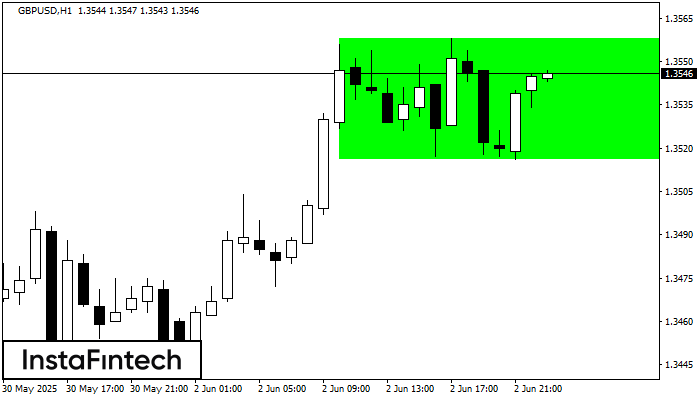
Berdasarkan carta H1, GBPUSD telah membentuk Segi Empat Menaik. Jenis corak ini menunjukkan kesinambungan aliran. Ia terdiri daripada dua tahap: rintangan 1.3558 dan sokongan 1.3516. Sekiranya tahap rintangan 1.3558
Open chart in a new window
Segi Tiga Simetri Menaik
was formed on 02.06 at 22:06:22 (UTC+0)
signal strength 1 of 5
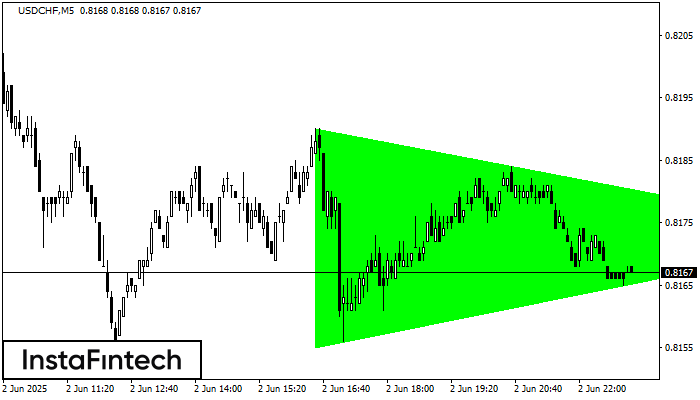
Berdasarkan carta M5, USDCHF membentuk corak Segi Tiga Simetri Menaik yang menandakan aliran akan berterusan. Penerangan. Sempadan atas corak menyentuh koordinat 0.8190/0.8173 sedangkan sempadan bawah merentasi 0.8155/0.8173. Lebar corak diukur
Carta masa M5 dan M15 mungkin mempunyai lebih banyak titik kemasukan palsu.
Open chart in a new window
Segi Tiga Simetri Menurun
was formed on 02.06 at 21:58:20 (UTC+0)
signal strength 1 of 5
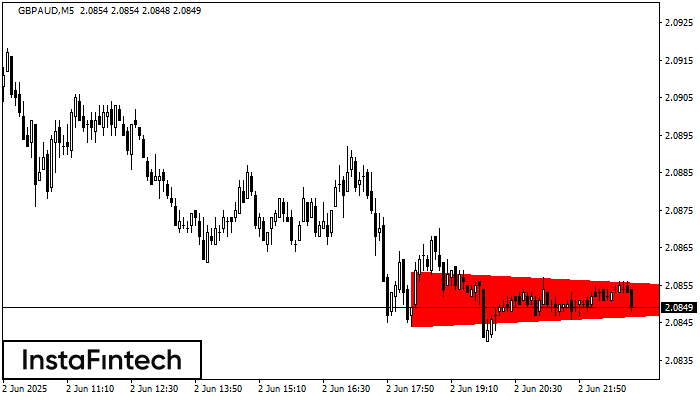
Berdasarkan carta M5, GBPAUD membentuk corak Segi Tiga Simetri Menurun. Penerangan: Sempadan yang lebih rendah ialah 2.0844/2.0851 dan sempadan atas adalah 2.0859/2.0851. Lebar corak diukur pada carta pada -15 pips
Carta masa M5 dan M15 mungkin mempunyai lebih banyak titik kemasukan palsu.
Open chart in a new window

