

Corak sebenar

Triple Top
was formed on 07.04 at 05:50:18 (UTC+0)
signal strength 1 of 5
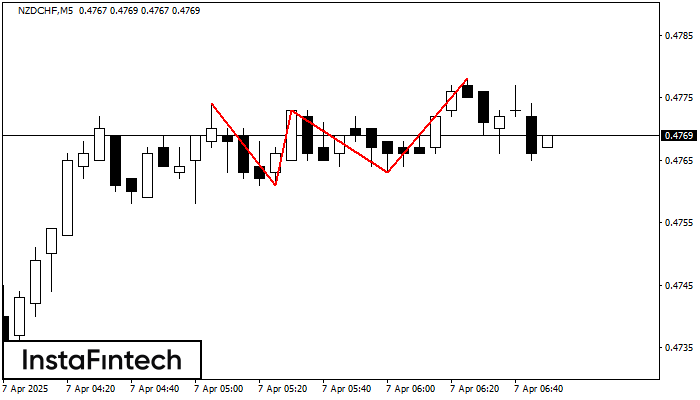
On the chart of the NZDCHF M5 trading instrument, the Triple Top pattern that signals a trend change has formed. It is possible that after formation of the third peak, the price will try to break through the resistance level 0.4761, where we advise to open a trading position for sale. Take profit is the projection of the pattern’s width, which is 13 points.
The M5 and M15 time frames may have more false entry points.
- All
- All
- Bearish Rectangle
- Bearish Symmetrical Triangle
- Bearish Symmetrical Triangle
- Bullish Rectangle
- Double Top
- Double Top
- Triple Bottom
- Triple Bottom
- Triple Top
- Triple Top
- All
- All
- Buy
- Sale
- All
- 1
- 2
- 3
- 4
- 5
Bawah Ganda
was formed on 30.05 at 12:31:28 (UTC+0)
signal strength 3 of 5
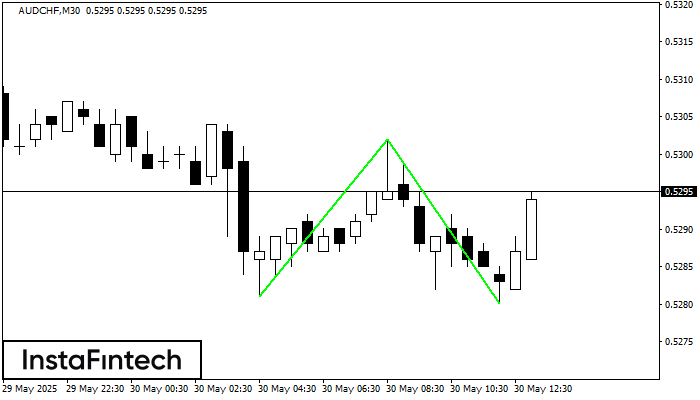
Pola Bawah Ganda telah terbentuk pada AUDCHF M30. Karakteristik: level support 0.5281; level resistance 0.5302; lebar pola 21 poin. Jika level resistance ditembus, perubahan dalam tren dapat diprediksi dengan target
Open chart in a new window
Bawah Ganda
was formed on 30.05 at 12:00:29 (UTC+0)
signal strength 2 of 5
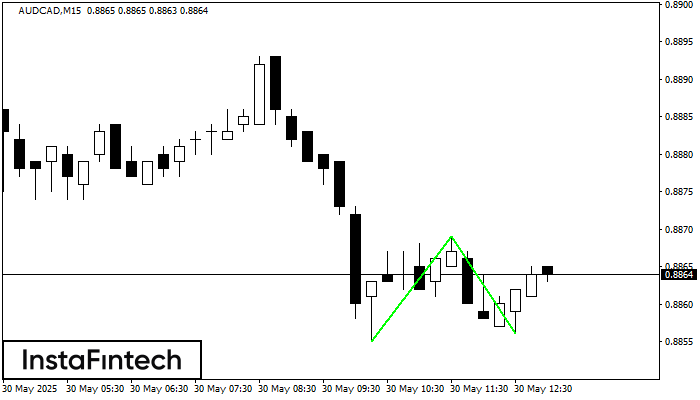
Pola Bawah Ganda telah terbentuk pada AUDCAD M15; batas atas di 0.8869; batas bawah di 0.8856. Lebar pola sebesar 14 poin. Jika harga menembus batas atas 0.8869, Perubahan dalam tren
Rangka waktu M5 dan M15 mungkin memiliki lebih dari titik entri yang keliru.
Open chart in a new window
Bawah Triple
was formed on 30.05 at 11:36:39 (UTC+0)
signal strength 1 of 5
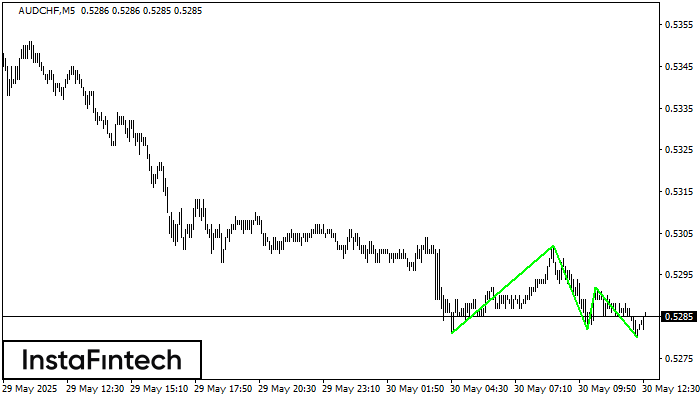
Pola Bawah Triple telah terbentuk pada grafik AUDCHF M5. Fitur-fitur pola: garis bawah pola memiliki koordinat 0.5302 dengan batas atas 0.5302/0.5292, proyeksi lebar adalah 21 poin. Pembentukan pola Bawah Triple
Rangka waktu M5 dan M15 mungkin memiliki lebih dari titik entri yang keliru.
Open chart in a new window


