

Corak sebenar

Triple Top
was formed on 07.04 at 05:36:16 (UTC+0)
signal strength 1 of 5
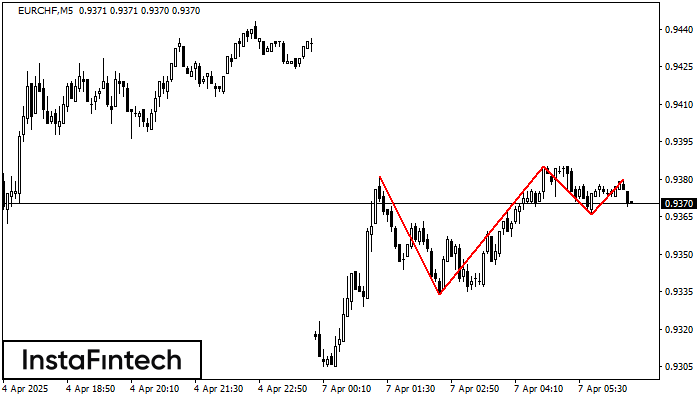
The Triple Top pattern has formed on the chart of the EURCHF M5. Features of the pattern: borders have an ascending angle; the lower line of the pattern has the coordinates 0.9334/0.9366 with the upper limit 0.9381/0.9380; the projection of the width is 47 points. The formation of the Triple Top figure most likely indicates a change in the trend from upward to downward. This means that in the event of a breakdown of the support level of 0.9334, the price is most likely to continue the downward movement.
The M5 and M15 time frames may have more false entry points.
Juga lihat
- All
- All
- Bearish Rectangle
- Bearish Symmetrical Triangle
- Bearish Symmetrical Triangle
- Bullish Rectangle
- Double Top
- Double Top
- Triple Bottom
- Triple Bottom
- Triple Top
- Triple Top
- All
- All
- Buy
- Sale
- All
- 1
- 2
- 3
- 4
- 5
Hình chữ nhật giảm
was formed on 28.05 at 15:05:49 (UTC+0)
signal strength 1 of 5
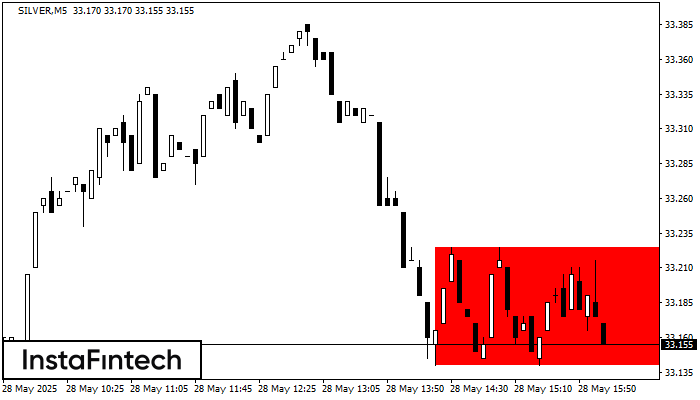
Theo biểu đồ của M5, SILVER đã tạo thành Hình chữ nhật giảm. Mô hình này cho thấy sự tiếp tục của xu hướng. Đường viền trên là 33.23, đường
Khung thời gian M5 và M15 có thể có nhiều điểm vào lệnh sai hơn.
Open chart in a new window
Tam giác Cân Tăng
was formed on 28.05 at 14:59:02 (UTC+0)
signal strength 2 of 5
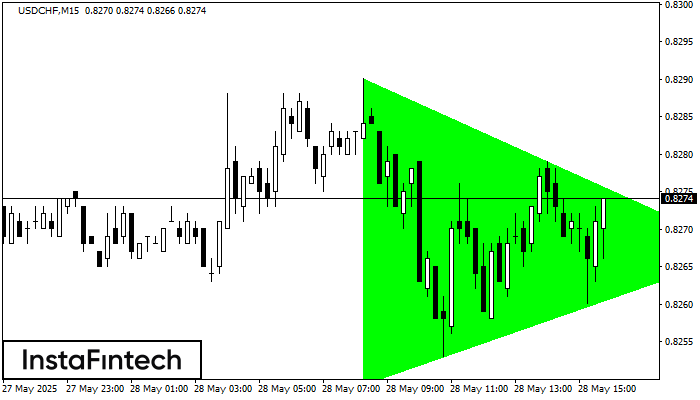
Theo biểu đồ của M15, USDCHF đã hình thành mô hình Tam giác Cân Tăng, điều mà báo hiệu xu hướng sẽ tiếp tục. Mô tả. Đường biên giới
Khung thời gian M5 và M15 có thể có nhiều điểm vào lệnh sai hơn.
Open chart in a new window
Đáy đôi
was formed on 28.05 at 14:36:46 (UTC+0)
signal strength 1 of 5
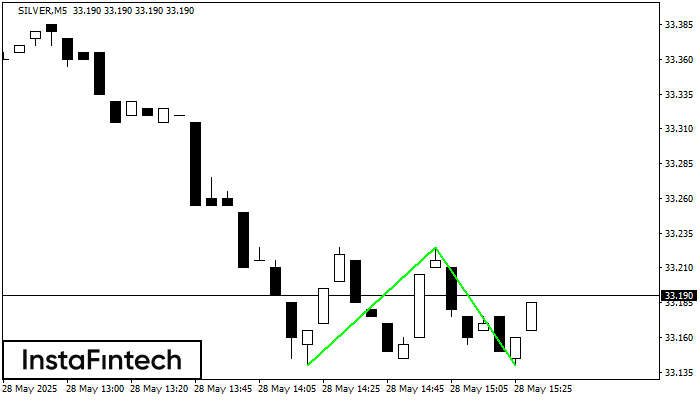
Mô hình Đáy đôi đã được hình thành trên SILVER M5. Đặc điểm: mức hỗ trợ 33.14; mức kháng cự 33.23; chiều rộng của mô hình 85 điểm
Khung thời gian M5 và M15 có thể có nhiều điểm vào lệnh sai hơn.
Open chart in a new window


