

Corak sebenar

Bearish pennant
was formed on 07.04 at 01:30:15 (UTC+0)
signal strength 3 of 5
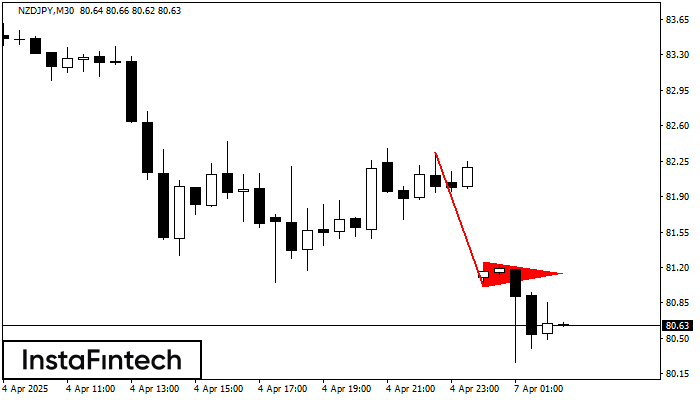
The Bearish pennant pattern has formed on the NZDJPY M30 chart. This pattern type is characterized by a slight slowdown after which the price will move in the direction of the original trend. In case the price fixes below the pattern’s low of 81.01, a trader will be able to successfully enter the sell position.
- All
- All
- Bearish Rectangle
- Bearish Symmetrical Triangle
- Bearish Symmetrical Triangle
- Bullish Rectangle
- Double Top
- Double Top
- Triple Bottom
- Triple Bottom
- Triple Top
- Triple Top
- All
- All
- Buy
- Sale
- All
- 1
- 2
- 3
- 4
- 5
Bullish pennant
was formed on 22.04 at 16:10:26 (UTC+0)
signal strength 1 of 5
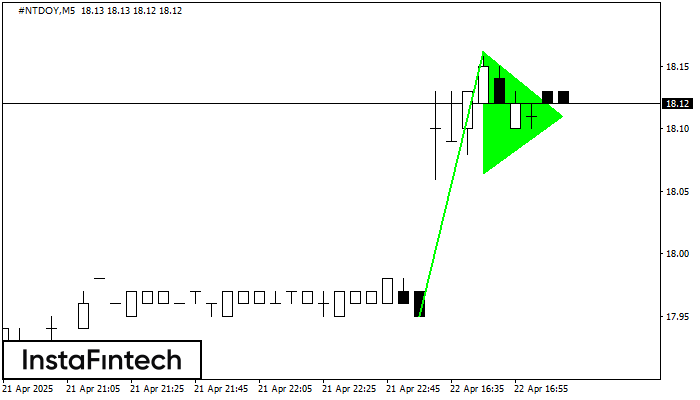
The Bullish pennant signal – Trading instrument #NTDOY M5, continuation pattern. Forecast: it is possible to set up a buy position above the pattern’s high of 18.16, with the prospect
The M5 and M15 time frames may have more false entry points.
Open chart in a new window
Bullish pennant
was formed on 22.04 at 16:10:18 (UTC+0)
signal strength 1 of 5
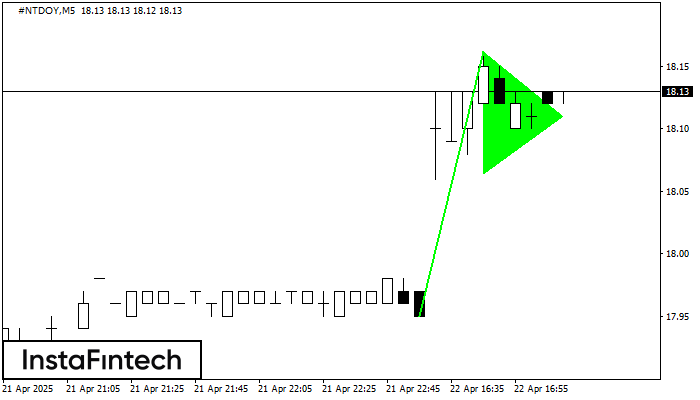
The Bullish pennant signal – Trading instrument #NTDOY M5, continuation pattern. Forecast: it is possible to set up a buy position above the pattern’s high of 18.16, with the prospect
The M5 and M15 time frames may have more false entry points.
Open chart in a new window
Bullish pennant
was formed on 22.04 at 16:05:23 (UTC+0)
signal strength 1 of 5
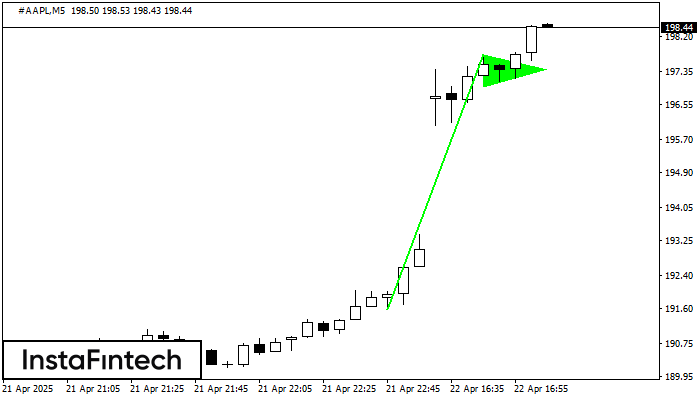
The Bullish pennant signal – Trading instrument #AAPL M5, continuation pattern. Forecast: it is possible to set up a buy position above the pattern’s high of 197.78, with the prospect
The M5 and M15 time frames may have more false entry points.
Open chart in a new window


