

Corak sebenar

Bearish Symmetrical Triangle
was formed on 04.04 at 03:30:52 (UTC+0)
signal strength 1 of 5
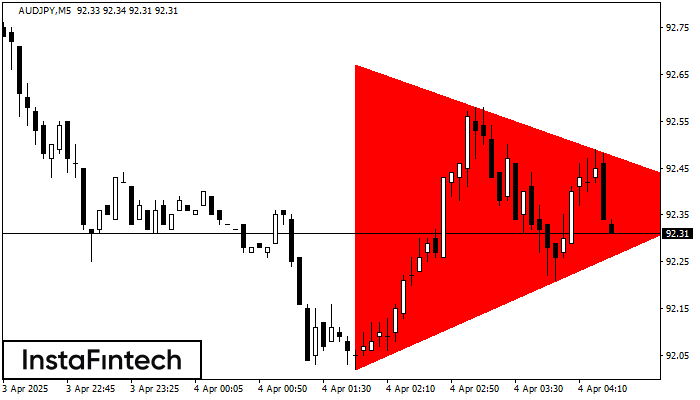
According to the chart of M5, AUDJPY formed the Bearish Symmetrical Triangle pattern. Description: The lower border is 92.02/92.38 and upper border is 92.67/92.38. The pattern width is measured on the chart at -65 pips. The formation of the Bearish Symmetrical Triangle pattern evidently signals a continuation of the downward trend. In other words, if the scenario comes true and AUDJPY breaches the lower border, the price could continue its move toward 92.23.
The M5 and M15 time frames may have more false entry points.
- All
- All
- Bearish Rectangle
- Bearish Symmetrical Triangle
- Bearish Symmetrical Triangle
- Bullish Rectangle
- Double Top
- Double Top
- Triple Bottom
- Triple Bottom
- Triple Top
- Triple Top
- All
- All
- Buy
- Sale
- All
- 1
- 2
- 3
- 4
- 5
Topo duplo
was formed on 25.04 at 11:40:02 (UTC+0)
signal strength 1 of 5
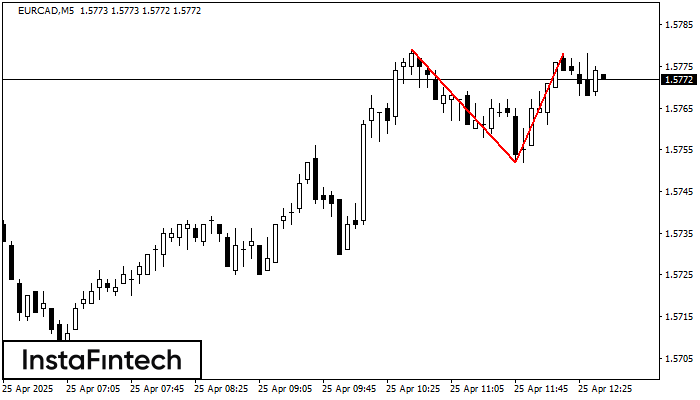
No gráfico de EURCAD M5 o padrão de reversão Topo duplo foi formado. Características: o limite superior 1.5778; o limite inferior 1.5752; a largura do padrão 26 pontos. O sinal
Os intervalos M5 e M15 podem ter mais pontos de entrada falsos.
Open chart in a new window
Fundo triplo
was formed on 25.04 at 11:34:47 (UTC+0)
signal strength 1 of 5
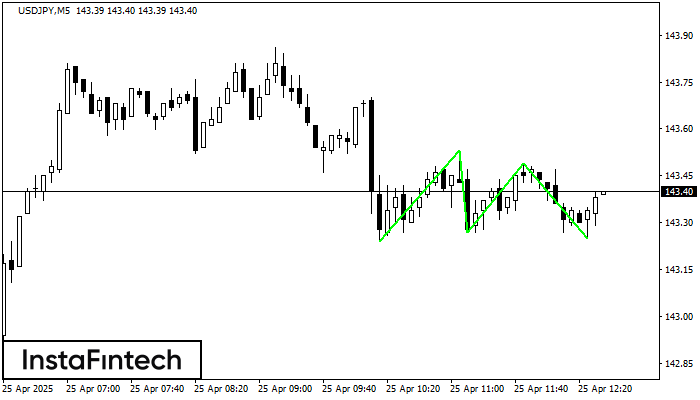
O padrão Fundo triplo foi formado em USDJPY M5. Possui as seguintes características: nível de resistência 143.53/143.49; nível de suporte 143.24/143.25; a largura é de 29 pontos. Se houver
Os intervalos M5 e M15 podem ter mais pontos de entrada falsos.
Open chart in a new window
Cabeça & Ombros
was formed on 25.04 at 11:16:23 (UTC+0)
signal strength 2 of 5

O padrão técnico chamado Cabeça & Ombros apareceu no gráfico de USDCHF M15. Há razões de peso para sugerir que o preço ultrapassará a Linha do Pescoço 0.8293/0.8295 após
Os intervalos M5 e M15 podem ter mais pontos de entrada falsos.
Open chart in a new window


