

Corak sebenar

Double Bottom
was formed on 03.04 at 17:09:50 (UTC+0)
signal strength 1 of 5
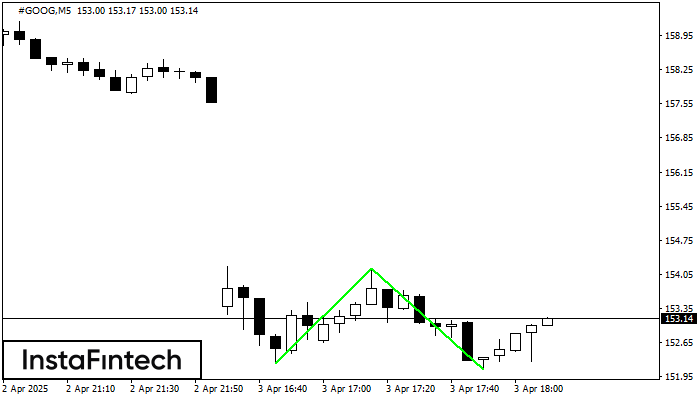
The Double Bottom pattern has been formed on #GOOG M5. Characteristics: the support level 152.21; the resistance level 154.17; the width of the pattern 196 points. If the resistance level is broken, a change in the trend can be predicted with the first target point lying at the distance of 207 points.
The M5 and M15 time frames may have more false entry points.
- All
- All
- Bearish Rectangle
- Bearish Symmetrical Triangle
- Bearish Symmetrical Triangle
- Bullish Rectangle
- Double Top
- Double Top
- Triple Bottom
- Triple Bottom
- Triple Top
- Triple Top
- All
- All
- Buy
- Sale
- All
- 1
- 2
- 3
- 4
- 5
รูปแบบกราฟสี่เหลี่ยมผืนผ้าขาขึ้น (Bullish Rectangle)
was formed on 05.06 at 21:05:51 (UTC+0)
signal strength 3 of 5
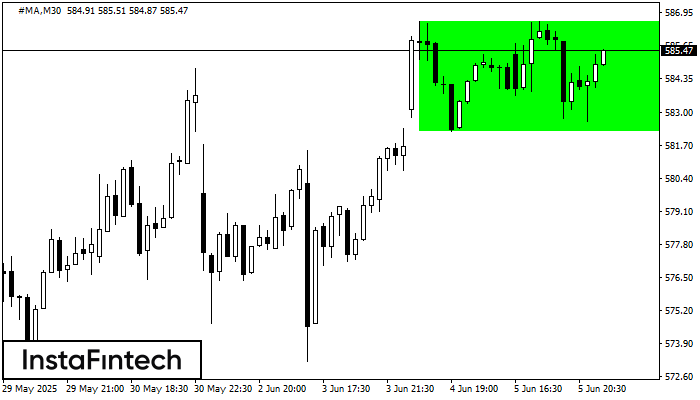
อ้างอิงจากชาร์ตของ M30, #MA ที่ได้สร้างรูปแบบ รูปแบบกราฟสี่เหลี่ยมผืนผ้าขาขึ้น (Bullish Rectangle) ออกมา รูปแบบประเภทนี้แสดงถึง ความต่อเนื่องในแนวโน้ม มันประกอบไปด้วยสองระดับ: แนวต้าน 586.61 และแนวรับ 582.27
Open chart in a new window
รูปแบบกราฟจุดสามยอดขาลง (Triple Bottom)
was formed on 05.06 at 21:05:11 (UTC+0)
signal strength 1 of 5
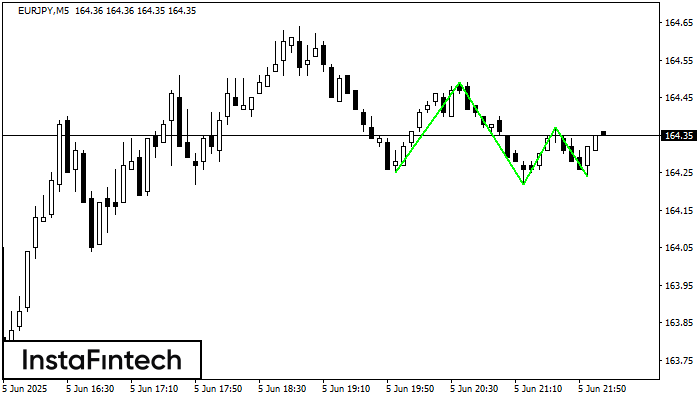
รูปแบบ รูปแบบกราฟจุดสามยอดขาลง (Triple Bottom) ได้สร้างขึ้นมาในชาร์ตของ EURJPY M5 ที่เป็นตราสารการซื้อขาย รูปแบบนี้แสดงถึงการเปลี่่ยนแปลงในแนวโน้มจากแนวโน้มขาลง ไปเป็นแนวโน้มขาขึ้น ในกรณีที่มีการเคลื่อนตัวทะลุผ่านที่ 164.49/164.37
ขอบเตระยะเวลาใน M5 และ M15 อาจจะมีตำแหน่งการเข้าใช้งานที่ผิดพลาดมากยิ่งขึ้น
Open chart in a new window
รูปแบบกราฟจุดสามยอดขาลง (Triple Bottom)
was formed on 05.06 at 21:00:23 (UTC+0)
signal strength 1 of 5
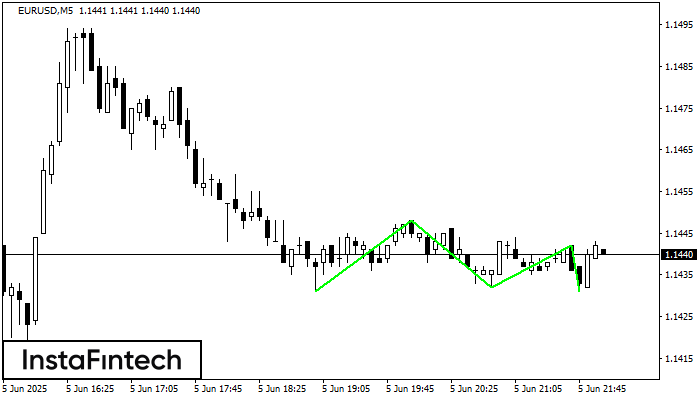
รูปแบบ รูปแบบกราฟจุดสามยอดขาลง (Triple Bottom) ได้ถูกสร้างขึ้นมาใน EURUSD M5 มันมี คุณลักษณะ ดังต่อไปนี้: ระดับแนวต้าน 1.1448/1.1442; ระดับของแนวรับ 1.1431/1.1431; ความกว้างคือ
ขอบเตระยะเวลาใน M5 และ M15 อาจจะมีตำแหน่งการเข้าใช้งานที่ผิดพลาดมากยิ่งขึ้น
Open chart in a new window


