

Corak sebenar

Bearish pennant
was formed on 03.04 at 15:29:56 (UTC+0)
signal strength 1 of 5
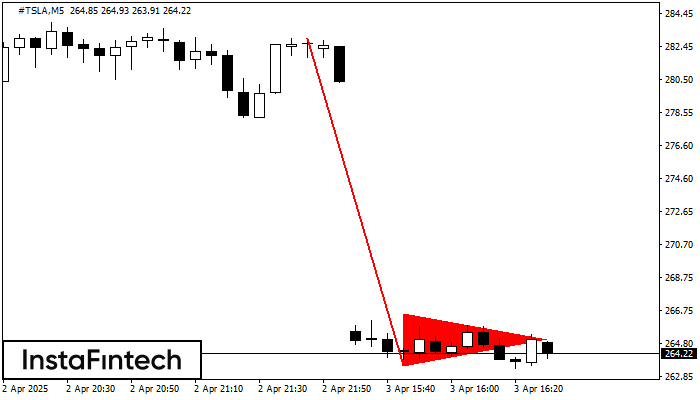
The Bearish pennant pattern has formed on the #TSLA M5 chart. This pattern type is characterized by a slight slowdown after which the price will move in the direction of the original trend. In case the price fixes below the pattern’s low of 263.52, a trader will be able to successfully enter the sell position.
The M5 and M15 time frames may have more false entry points.
Juga lihat
- All
- All
- Bearish Rectangle
- Bearish Symmetrical Triangle
- Bearish Symmetrical Triangle
- Bullish Rectangle
- Double Top
- Double Top
- Triple Bottom
- Triple Bottom
- Triple Top
- Triple Top
- All
- All
- Buy
- Sale
- All
- 1
- 2
- 3
- 4
- 5
Double Top
was formed on 06.06 at 05:05:28 (UTC+0)
signal strength 1 of 5
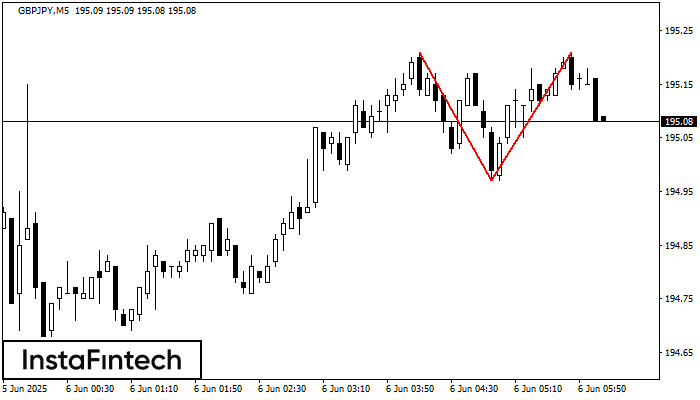
Corak pembalikan Double Top telah dibentuk pada GBPJPY M5. Ciri-ciri: sempadan atas %P0.000000; sempadan bawah 195.21; sempadan bawah 194.97; lebar corak adalah 24 mata. Dagangan menjual adalah lebih baik untuk
Carta masa M5 dan M15 mungkin mempunyai lebih banyak titik kemasukan palsu.
Open chart in a new window
Head dan Shoulders
was formed on 06.06 at 05:01:27 (UTC+0)
signal strength 4 of 5
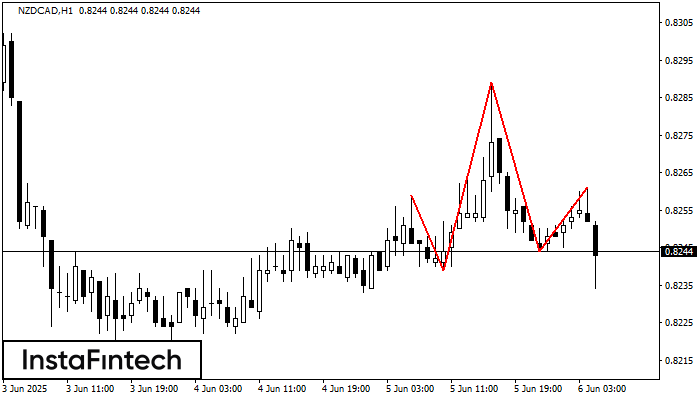
Corak teknikal yang dipanggil Head dan Shoulders telah muncul pada carta NZDCAD H1. Terdapat alasan yang berat untuk menunjukkan bahawa harga akan mengatasi garisan Neck 0.8239/0.8244 selepas Shoulder kanan telah
Open chart in a new window
Inverse Head dan Shoulder
was formed on 06.06 at 05:00:19 (UTC+0)
signal strength 4 of 5
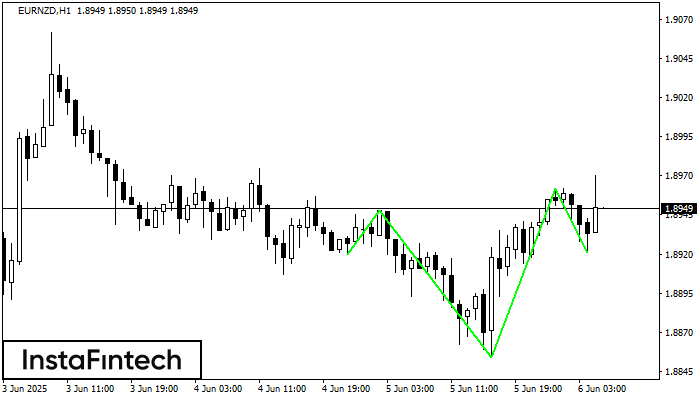
According to H1, EURNZD is shaping the technical pattern – the Inverse Head dan Shoulder. In case the Neckline 1.8948/1.8962 is broken out, the instrument is likely to move toward
Open chart in a new window

