

Corak sebenar

Double Bottom
was formed on 03.04 at 15:04:53 (UTC+0)
signal strength 1 of 5
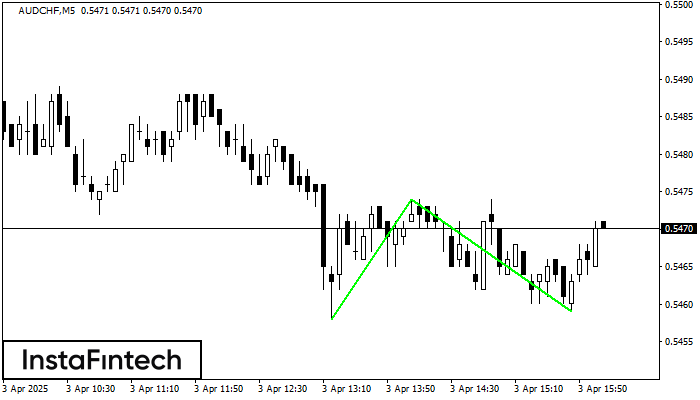
The Double Bottom pattern has been formed on AUDCHF M5. This formation signals a reversal of the trend from downwards to upwards. The signal is that a buy trade should be opened after the upper boundary of the pattern 0.5474 is broken. The further movements will rely on the width of the current pattern 16 points.
The M5 and M15 time frames may have more false entry points.
- All
- All
- Bearish Rectangle
- Bearish Symmetrical Triangle
- Bearish Symmetrical Triangle
- Bullish Rectangle
- Double Top
- Double Top
- Triple Bottom
- Triple Bottom
- Triple Top
- Triple Top
- All
- All
- Buy
- Sale
- All
- 1
- 2
- 3
- 4
- 5
Triple Top
was formed on 30.05 at 22:20:23 (UTC+0)
signal strength 1 of 5

Corak Triple Top telah dibentuk pada carta bagi instrumen dagangan GOLD M5. Ia adalah corak pembalikan yang memaparkan ciri-ciri berikut: tahap rintangan 4, tahap sokongan -193, dan lebar corak
Carta masa M5 dan M15 mungkin mempunyai lebih banyak titik kemasukan palsu.
Open chart in a new window
Inverse Head dan Shoulder
was formed on 30.05 at 21:50:24 (UTC+0)
signal strength 1 of 5

Berdasarkan carta M5, #AMZN menghasilkan corak yang dinyatakan Inverse Head dan Shoulder. Head telah ditetapkan pada 201.64 manakala garisan median Neck ditetapkan pada 204.52/205.01. Pembentukan Corak Inverse Head dan Shoulder
Carta masa M5 dan M15 mungkin mempunyai lebih banyak titik kemasukan palsu.
Open chart in a new window
Segi Empat Menurun
was formed on 30.05 at 21:36:36 (UTC+0)
signal strength 1 of 5

Berdasarkan carta M5, GBPAUD telah membentuk Segi Empat Menurun yang merupakan corak kesinambungan aliran. Corak terkandung dalam sempadan berikut: sempadan bawah 2.0897 – 2.0897 dan sempadan atas 2.0908 – 2.0908
Carta masa M5 dan M15 mungkin mempunyai lebih banyak titik kemasukan palsu.
Open chart in a new window

