

Corak sebenar

Double Bottom
was formed on 03.04 at 07:15:16 (UTC+0)
signal strength 2 of 5
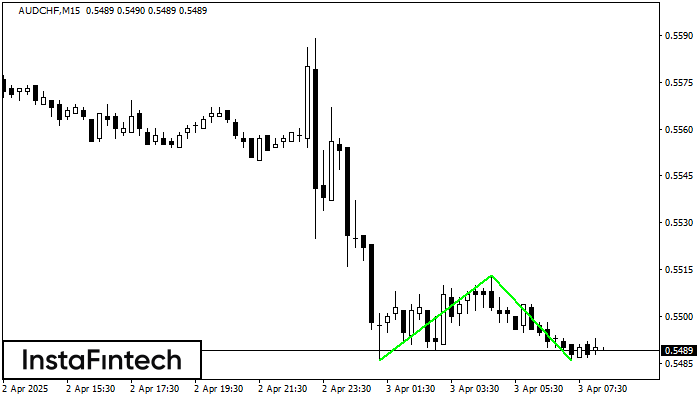
The Double Bottom pattern has been formed on AUDCHF M15. This formation signals a reversal of the trend from downwards to upwards. The signal is that a buy trade should be opened after the upper boundary of the pattern 0.5513 is broken. The further movements will rely on the width of the current pattern 27 points.
The M5 and M15 time frames may have more false entry points.
Juga lihat
- All
- All
- Bearish Rectangle
- Bearish Symmetrical Triangle
- Bearish Symmetrical Triangle
- Bullish Rectangle
- Double Top
- Double Top
- Triple Bottom
- Triple Bottom
- Triple Top
- Triple Top
- All
- All
- Buy
- Sale
- All
- 1
- 2
- 3
- 4
- 5
Bawah Ganda
was formed on 04.06 at 01:45:26 (UTC+0)
signal strength 2 of 5
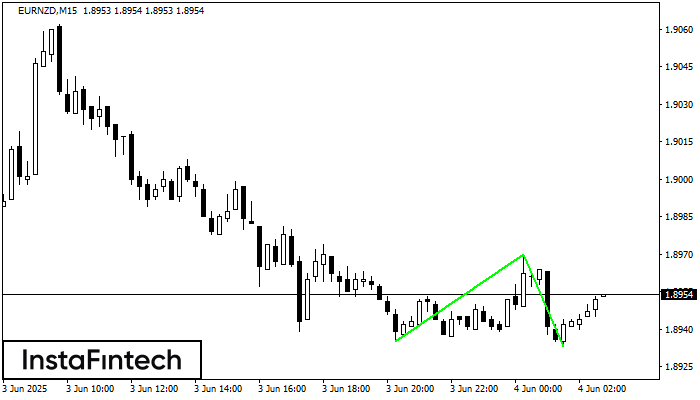
Pola Bawah Ganda telah terbentuk pada EURNZD M15; batas atas di 1.8970; batas bawah di 1.8933. Lebar pola sebesar 35 poin. Jika harga menembus batas atas 1.8970, Perubahan dalam tren
Rangka waktu M5 dan M15 mungkin memiliki lebih dari titik entri yang keliru.
Open chart in a new window
Teratas Ganda
was formed on 04.06 at 01:45:10 (UTC+0)
signal strength 2 of 5
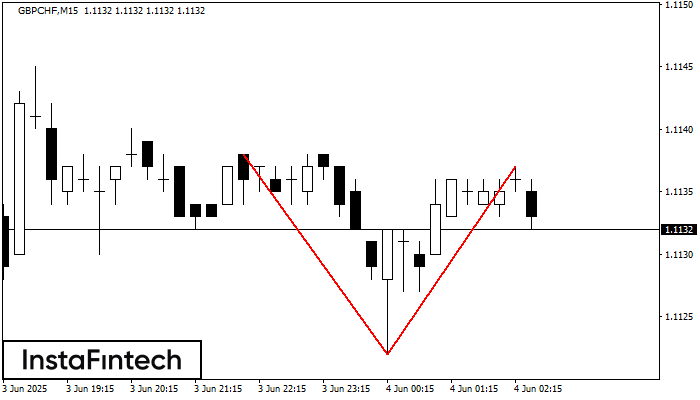
Pada grafik GBPCHF M15 pola reversal Teratas Ganda telah terbentuk. Karakteristik: batas atas 1.1137; batas bawah 1.1122; lebar pola 15 poin. Sinyal: tembusan ke batas bawah akan menyebabkan kelanjutan tren
Rangka waktu M5 dan M15 mungkin memiliki lebih dari titik entri yang keliru.
Open chart in a new window
Segitiga Simetris Bullish
was formed on 04.06 at 01:16:46 (UTC+0)
signal strength 1 of 5
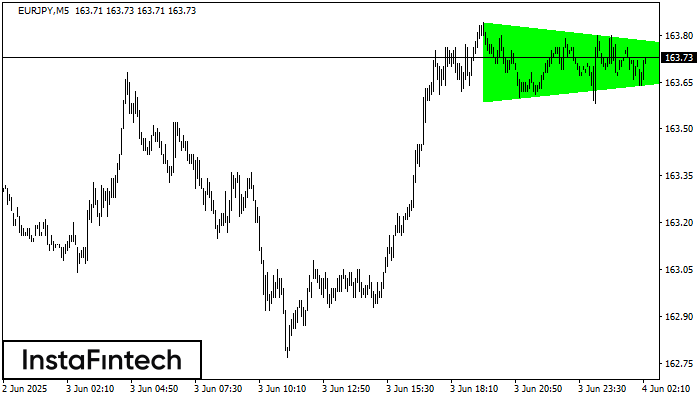
Menurut Grafik dari M5, EURJPY dibentuk pola Segitiga Simetris Bullish, yang menunjukkan tren akan berlanjut. Deksripsi. Batas atas dari pola menyentuh kordinat 163.84/163.71 dimana batas yang lebih rendah berada sepanjang
Rangka waktu M5 dan M15 mungkin memiliki lebih dari titik entri yang keliru.
Open chart in a new window


