

Corak sebenar

Triple Bottom
was formed on 03.04 at 04:50:12 (UTC+0)
signal strength 1 of 5
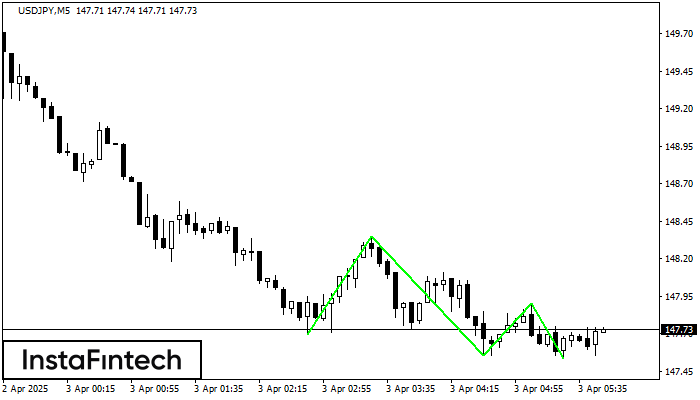
The Triple Bottom pattern has formed on the chart of USDJPY M5. Features of the pattern: The lower line of the pattern has coordinates 148.35 with the upper limit 148.35/147.90, the projection of the width is 65 points. The formation of the Triple Bottom pattern most likely indicates a change in the trend from downward to upward. This means that in the event of a breakdown of the resistance level 147.70, the price is most likely to continue the upward movement.
The M5 and M15 time frames may have more false entry points.
- All
- All
- Bearish Rectangle
- Bearish Symmetrical Triangle
- Bearish Symmetrical Triangle
- Bullish Rectangle
- Double Top
- Double Top
- Triple Bottom
- Triple Bottom
- Triple Top
- Triple Top
- All
- All
- Buy
- Sale
- All
- 1
- 2
- 3
- 4
- 5
Double Top
was formed on 02.06 at 23:17:32 (UTC+0)
signal strength 2 of 5
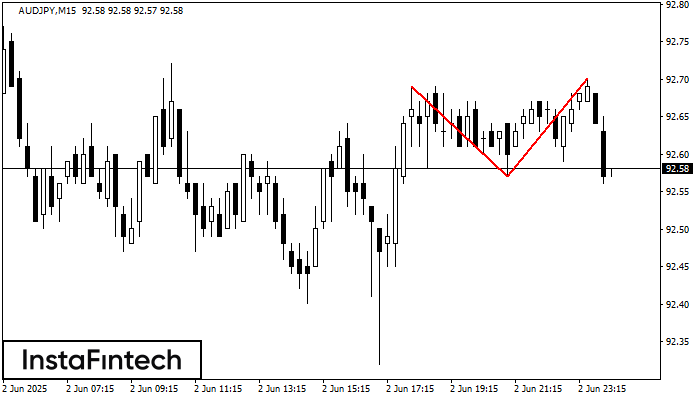
Corak Double Top telah dibentuk pada AUDJPY M15. Isyarat bahawa aliran telah berubah dari aliran menaik ke aliran menurun. Mungkin, sekiranya asas corak 92.57 ditembusi, pergerakan menurun akan berterusan
Carta masa M5 dan M15 mungkin mempunyai lebih banyak titik kemasukan palsu.
Open chart in a new window
Triple Top
was formed on 02.06 at 23:11:50 (UTC+0)
signal strength 1 of 5
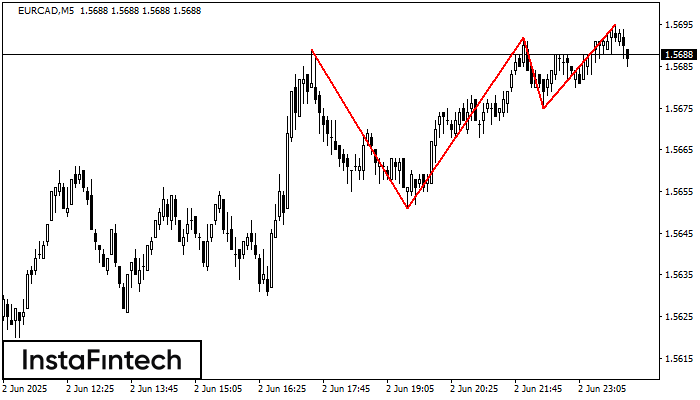
Corak Triple Top telah dibentuk pada carta EURCAD M5. Ciri corak: sempadan mempunyai sudut menaik; garisan bawah corak mempunyai koordinat 1.5651/1.5675 dengan had atas 1.5689/1.5695; unjuran lebar ialah 38 mata
Carta masa M5 dan M15 mungkin mempunyai lebih banyak titik kemasukan palsu.
Open chart in a new window
Double Top
was formed on 02.06 at 23:00:37 (UTC+0)
signal strength 5 of 5
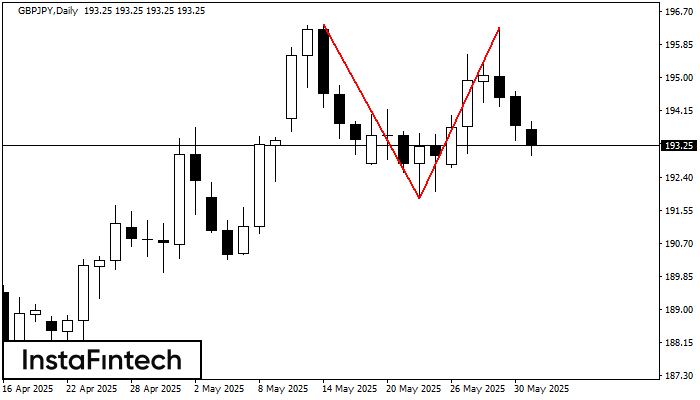
Corak pembalikan Double Top telah dibentuk pada GBPJPY D1. Ciri-ciri: sempadan atas %P0.000000; sempadan bawah 196.38; sempadan bawah 191.87; lebar corak adalah 441 mata. Dagangan menjual adalah lebih baik untuk
Open chart in a new window

