

Corak sebenar

Bullish Rectangle
was formed on 02.04 at 15:25:46 (UTC+0)
signal strength 1 of 5
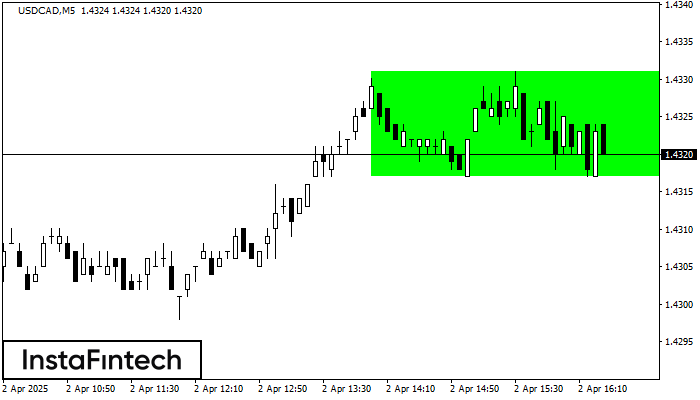
According to the chart of M5, USDCAD formed the Bullish Rectangle which is a pattern of a trend continuation. The pattern is contained within the following borders: the lower border 1.4317 – 1.4317 and upper border 1.4331 – 1.4331. In case the upper border is broken, the instrument is likely to follow the upward trend.
The M5 and M15 time frames may have more false entry points.
- All
- All
- Bearish Rectangle
- Bearish Symmetrical Triangle
- Bearish Symmetrical Triangle
- Bullish Rectangle
- Double Top
- Double Top
- Triple Bottom
- Triple Bottom
- Triple Top
- Triple Top
- All
- All
- Buy
- Sale
- All
- 1
- 2
- 3
- 4
- 5
Bullish Symmetrical Triangle
сформирован 05.06 в 07:50:14 (UTC+0)
сила сигнала 1 из 5
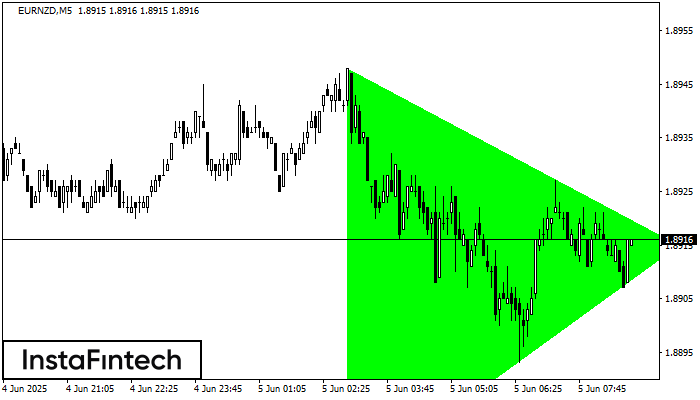
According to the chart of M5, EURNZD formed the Bullish Symmetrical Triangle pattern. Description: This is the pattern of a trend continuation. 1.8948 and 1.8870 are the coordinates
The M5 and M15 time frames may have more false entry points.
Открыть график инструмента в новом окне
Bearish Symmetrical Triangle
сформирован 05.06 в 07:33:52 (UTC+0)
сила сигнала 3 из 5
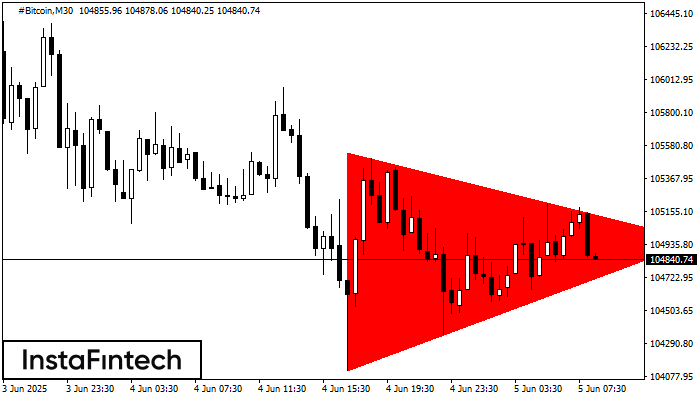
According to the chart of M30, #Bitcoin formed the Bearish Symmetrical Triangle pattern. Trading recommendations: A breach of the lower border 104115.57 is likely to encourage a continuation
Открыть график инструмента в новом окне
Bearish Symmetrical Triangle
сформирован 05.06 в 07:33:52 (UTC+0)
сила сигнала 2 из 5
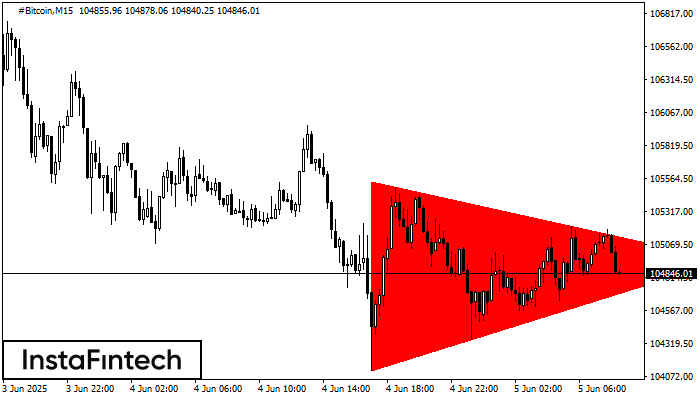
According to the chart of M15, #Bitcoin formed the Bearish Symmetrical Triangle pattern. Description: The lower border is 104115.57/104946.04 and upper border is 105540.33/104946.04. The pattern width is measured
The M5 and M15 time frames may have more false entry points.
Открыть график инструмента в новом окне


