

Corak sebenar

Triple Bottom
was formed on 02.04 at 13:40:27 (UTC+0)
signal strength 1 of 5
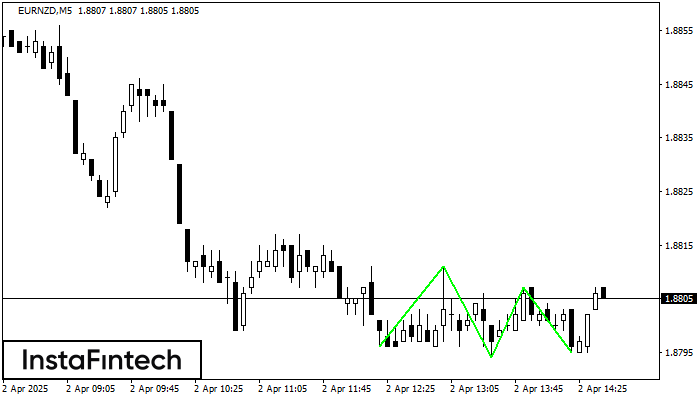
The Triple Bottom pattern has formed on the chart of EURNZD M5. Features of the pattern: The lower line of the pattern has coordinates 1.8811 with the upper limit 1.8811/1.8807, the projection of the width is 15 points. The formation of the Triple Bottom pattern most likely indicates a change in the trend from downward to upward. This means that in the event of a breakdown of the resistance level 1.8796, the price is most likely to continue the upward movement.
The M5 and M15 time frames may have more false entry points.
- All
- All
- Bearish Rectangle
- Bearish Symmetrical Triangle
- Bearish Symmetrical Triangle
- Bullish Rectangle
- Double Top
- Double Top
- Triple Bottom
- Triple Bottom
- Triple Top
- Triple Top
- All
- All
- Buy
- Sale
- All
- 1
- 2
- 3
- 4
- 5
Triple Top
was formed on 28.05 at 16:45:20 (UTC+0)
signal strength 1 of 5
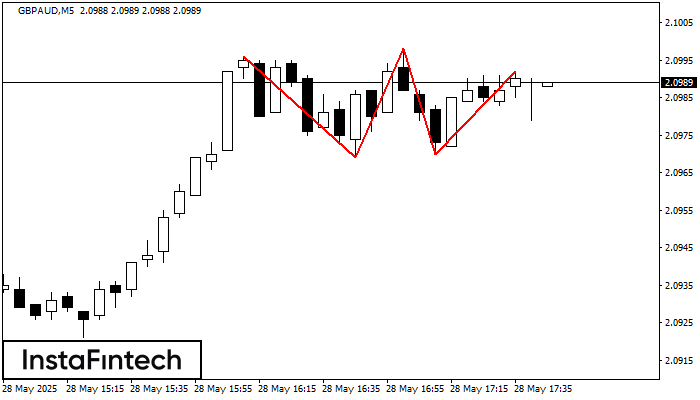
The Triple Top pattern has formed on the chart of the GBPAUD M5 trading instrument. It is a reversal pattern featuring the following characteristics: resistance level 4, support level -1
The M5 and M15 time frames may have more false entry points.
Open chart in a new window
Triple Top
was formed on 28.05 at 16:30:35 (UTC+0)
signal strength 3 of 5
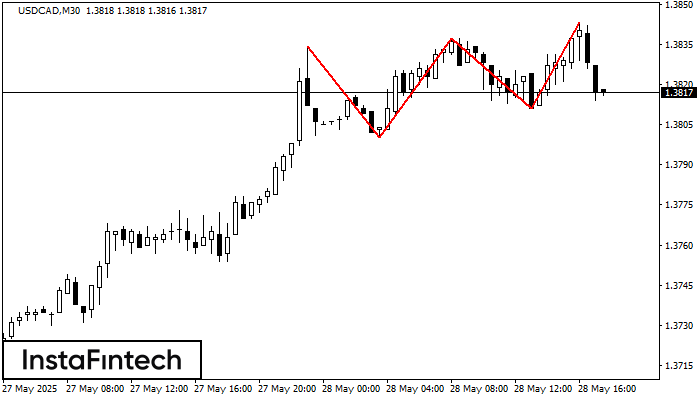
The Triple Top pattern has formed on the chart of the USDCAD M30. Features of the pattern: borders have an ascending angle; the lower line of the pattern
Open chart in a new window
Bullish Rectangle
was formed on 28.05 at 16:27:21 (UTC+0)
signal strength 1 of 5
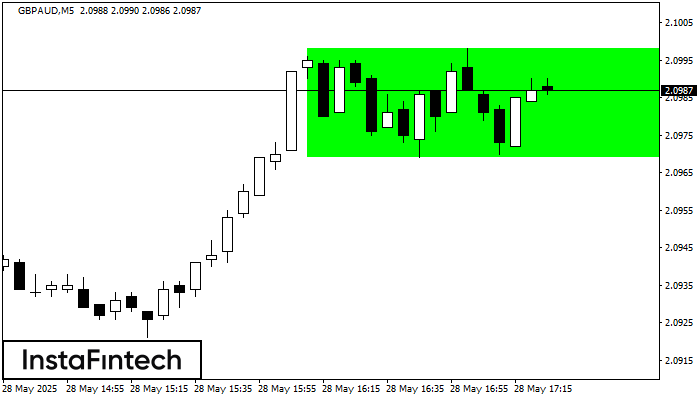
According to the chart of M5, GBPAUD formed the Bullish Rectangle which is a pattern of a trend continuation. The pattern is contained within the following borders: the lower border
The M5 and M15 time frames may have more false entry points.
Open chart in a new window


