

Corak sebenar

Double Bottom
was formed on 02.04 at 10:40:27 (UTC+0)
signal strength 1 of 5
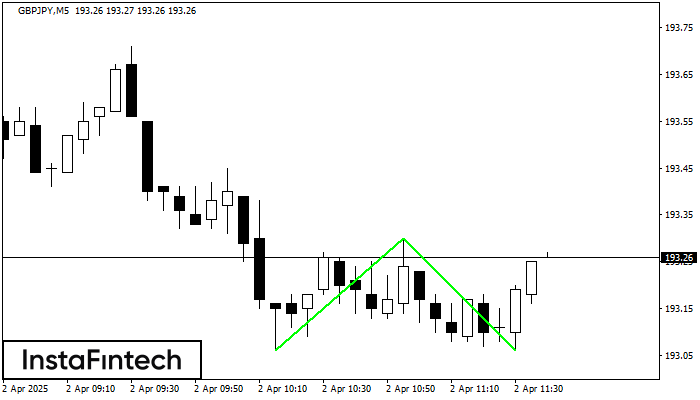
The Double Bottom pattern has been formed on GBPJPY M5; the upper boundary is 193.30; the lower boundary is 193.06. The width of the pattern is 24 points. In case of a break of the upper boundary 193.30, a change in the trend can be predicted where the width of the pattern will coincide with the distance to a possible take profit level.
The M5 and M15 time frames may have more false entry points.
- All
- All
- Bearish Rectangle
- Bearish Symmetrical Triangle
- Bearish Symmetrical Triangle
- Bullish Rectangle
- Double Top
- Double Top
- Triple Bottom
- Triple Bottom
- Triple Top
- Triple Top
- All
- All
- Buy
- Sale
- All
- 1
- 2
- 3
- 4
- 5
Double Bottom
was formed on 24.04 at 13:00:18 (UTC+0)
signal strength 2 of 5
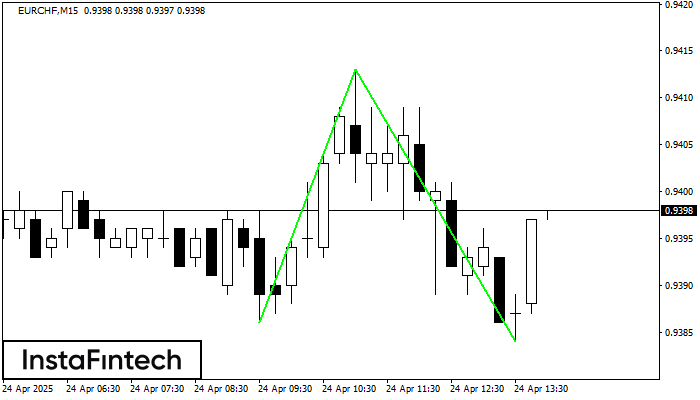
Corak Double Bottom telah dibentuk pada EURCHF M15. Ciri-ciri: tahap sokongan 0.9386; tahap rintangan 0.9413; lebar corak 27 mata. Sekiranya tahap rintangan ditembusi, perubahan aliran boleh diramalkan dengan titik sasaran
Carta masa M5 dan M15 mungkin mempunyai lebih banyak titik kemasukan palsu.
Open chart in a new window
Double Top
was formed on 24.04 at 12:35:33 (UTC+0)
signal strength 1 of 5
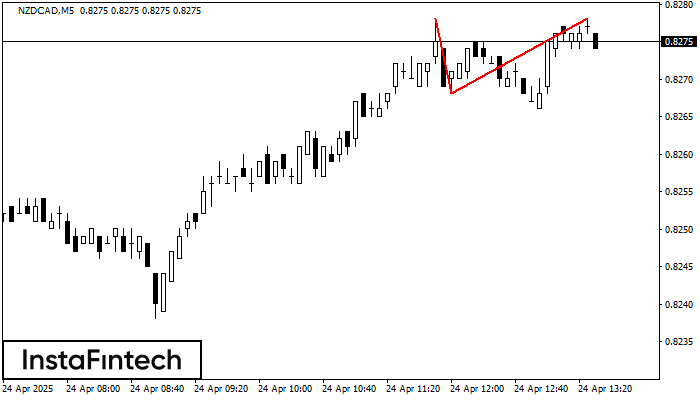
Corak pembalikan Double Top telah dibentuk pada NZDCAD M5. Ciri-ciri: sempadan atas %P0.000000; sempadan bawah 0.8278; sempadan bawah 0.8268; lebar corak adalah 10 mata. Dagangan menjual adalah lebih baik untuk
Carta masa M5 dan M15 mungkin mempunyai lebih banyak titik kemasukan palsu.
Open chart in a new window
Segi Empat Menurun
was formed on 24.04 at 12:34:50 (UTC+0)
signal strength 1 of 5
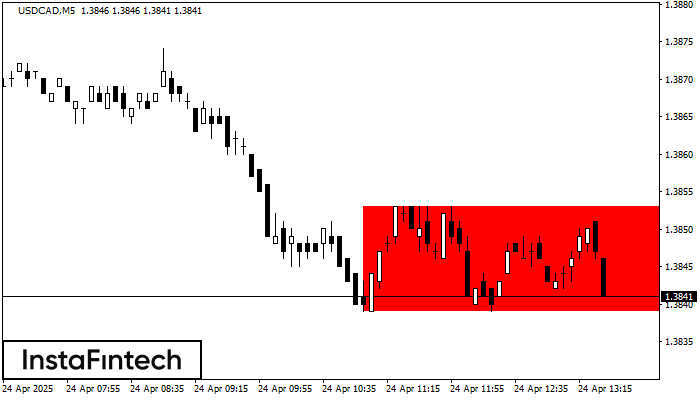
Berdasarkan carta M5, USDCAD telah membentuk Segi Empat Menurun yang merupakan corak kesinambungan aliran. Corak terkandung dalam sempadan berikut: sempadan bawah 1.3839 – 1.3839 dan sempadan atas 1.3853 – 1.3853
Carta masa M5 dan M15 mungkin mempunyai lebih banyak titik kemasukan palsu.
Open chart in a new window


