

Corak sebenar

Bullish Symmetrical Triangle
was formed on 02.04 at 10:35:34 (UTC+0)
signal strength 1 of 5
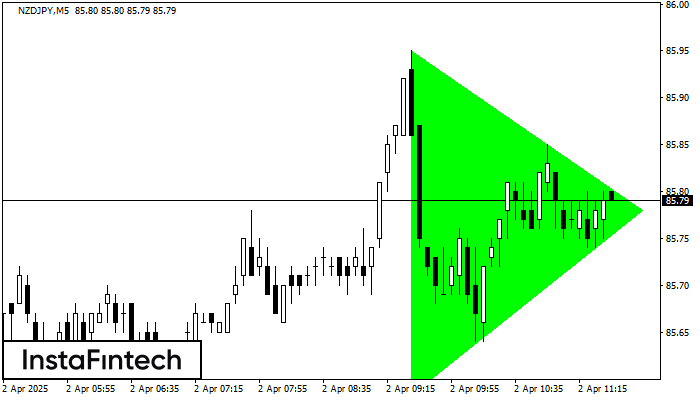
According to the chart of M5, NZDJPY formed the Bullish Symmetrical Triangle pattern, which signals the trend will continue. Description. The upper border of the pattern touches the coordinates 85.95/85.78 whereas the lower border goes across 85.58/85.78. The pattern width is measured on the chart at 37 pips. If the Bullish Symmetrical Triangle pattern is in progress during the upward trend, this indicates the current trend will go on. In case 85.78 is broken, the price could continue its move toward 85.93.
The M5 and M15 time frames may have more false entry points.
- All
- All
- Bearish Rectangle
- Bearish Symmetrical Triangle
- Bearish Symmetrical Triangle
- Bullish Rectangle
- Double Top
- Double Top
- Triple Bottom
- Triple Bottom
- Triple Top
- Triple Top
- All
- All
- Buy
- Sale
- All
- 1
- 2
- 3
- 4
- 5
Двойная вершина
сформирован 02.06 в 03:20:17 (UTC+0)
сила сигнала 1 из 5
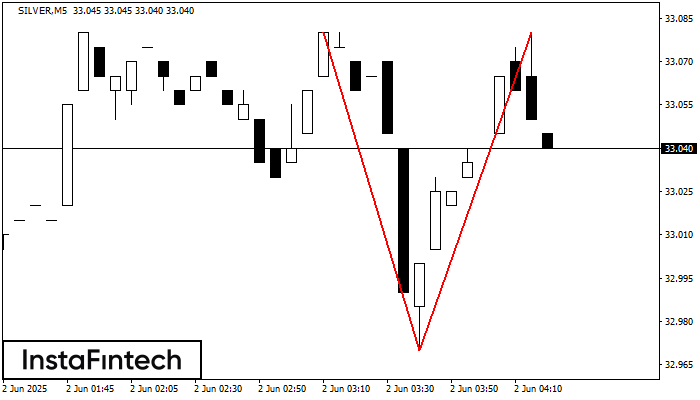
По торговому инструменту SILVER на M5 сформировалась фигура «Двойная вершина», которая сигнализирует нам об изменении тенденции с восходящей на нисходящую. Вероятно, что, в случае пробоя основания фигуры 32.97, возможно дальнейшее
Таймфреймы М5 и М15 могут иметь больше ложных точек входа.
Открыть график инструмента в новом окне
Бычий вымпел
сформирован 02.06 в 02:15:09 (UTC+0)
сила сигнала 2 из 5
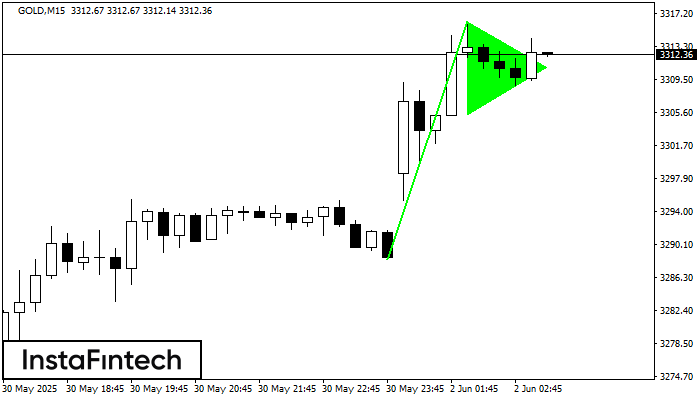
На графике GOLD M15 сформировался паттерн «Бычий вымпел», который относится к фигуре продолжения тренда. Можно предполагать, что, в случае фиксации цены выше максимума вымпела 3316.23, возможно дальнейшее восходящее движение
Таймфреймы М5 и М15 могут иметь больше ложных точек входа.
Открыть график инструмента в новом окне
Двойная вершина
сформирован 02.06 в 02:00:45 (UTC+0)
сила сигнала 2 из 5
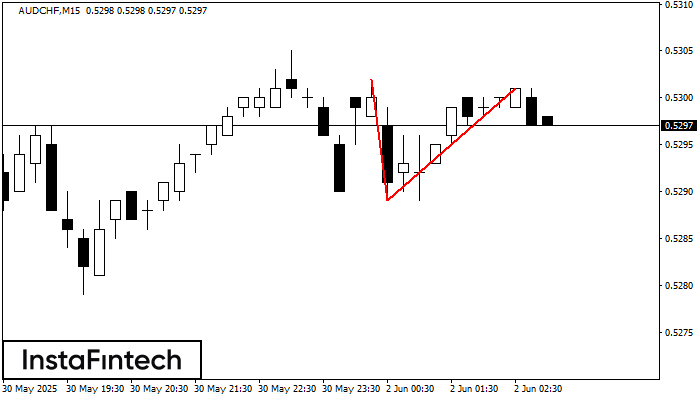
На торговом графике AUDCHF M15 сформировалась разворотная фигура «Двойная вершина». Характеристика: Верхняя граница 0.5301; Нижняя граница 0.5289; Ширина фигуры 12 пунктов. Сигнал: Пробой нижней границы 0.5289 приведет к дальнейшему нисходящему
Таймфреймы М5 и М15 могут иметь больше ложных точек входа.
Открыть график инструмента в новом окне

