

Corak sebenar

Bullish Flag
was formed on 02.04 at 04:20:19 (UTC+0)
signal strength 1 of 5
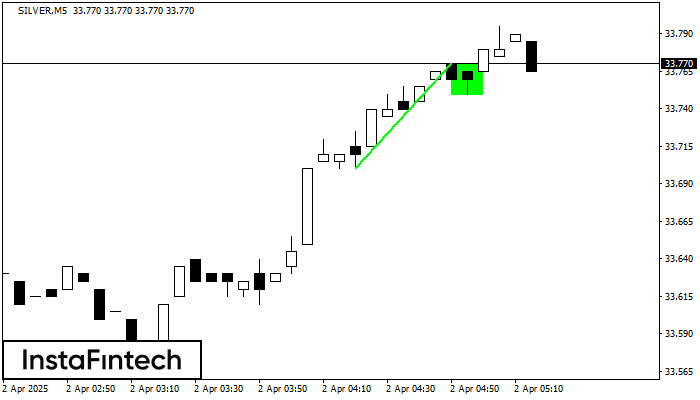
The Bullish Flag pattern has been formed on the chart SILVER M5 which signals that the upward trend will continue. Signals: а break of the peak at 33.77 may push the price higher, and the rise will be the projection of the pole.
The M5 and M15 time frames may have more false entry points.
Juga lihat
- All
- All
- Bearish Rectangle
- Bearish Symmetrical Triangle
- Bearish Symmetrical Triangle
- Bullish Rectangle
- Double Top
- Double Top
- Triple Bottom
- Triple Bottom
- Triple Top
- Triple Top
- All
- All
- Buy
- Sale
- All
- 1
- 2
- 3
- 4
- 5
Segi Empat Menaik
was formed on 03.06 at 23:47:07 (UTC+0)
signal strength 1 of 5
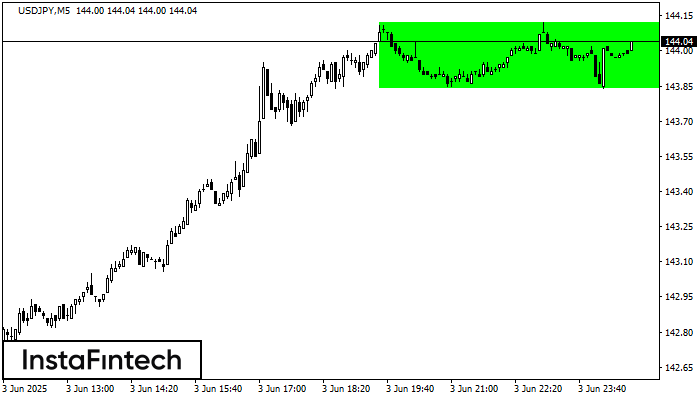
Berdasarkan carta M5, USDJPY telah membentuk Segi Empat Menaik. Jenis corak ini menunjukkan kesinambungan aliran. Ia terdiri daripada dua tahap: rintangan 144.12 dan sokongan 143.84. Sekiranya tahap rintangan 144.12
Carta masa M5 dan M15 mungkin mempunyai lebih banyak titik kemasukan palsu.
Open chart in a new window
Segi Empat Menaik
was formed on 03.06 at 23:46:54 (UTC+0)
signal strength 2 of 5
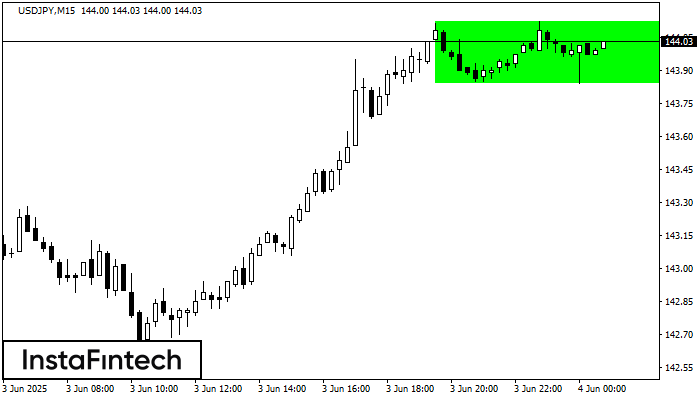
Berdasarkan carta M15, USDJPY telah membentuk Segi Empat Menaik yang merupakan corak kesinambungan aliran. Corak adalah terkandung dalam sempadan berikut: sempadan bawah 143.84 – 143.84 dan sempadan atas 144.12 –
Carta masa M5 dan M15 mungkin mempunyai lebih banyak titik kemasukan palsu.
Open chart in a new window
Double Top
was formed on 03.06 at 23:30:37 (UTC+0)
signal strength 3 of 5
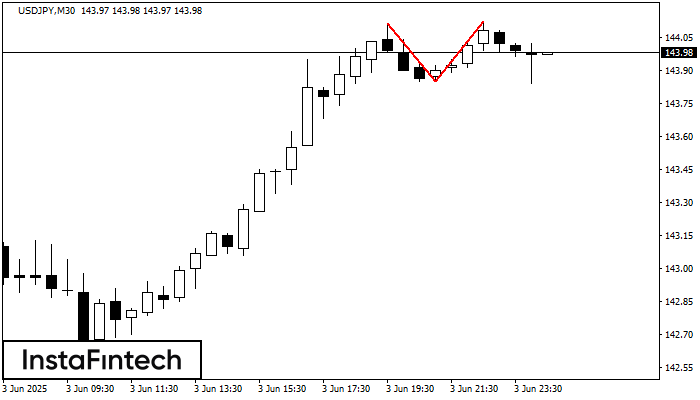
Corak pembalikan Double Top telah dibentuk pada USDJPY M30. Ciri-ciri: sempadan atas %P0.000000; sempadan bawah 144.11; sempadan bawah 143.85; lebar corak adalah 27 mata. Dagangan menjual adalah lebih baik untuk
Open chart in a new window


